Can we predict what the next hub of tech entrepreneurship will be? Could we pinpoint where the next real estate boom will be and invest there? Thanks to advances in machine learning and easier access to public data through Open Data initiatives, we can now explore these types of questions.
Read More »Blog
Exploring Tech Stocks: A Data Application Versus Data Visualization
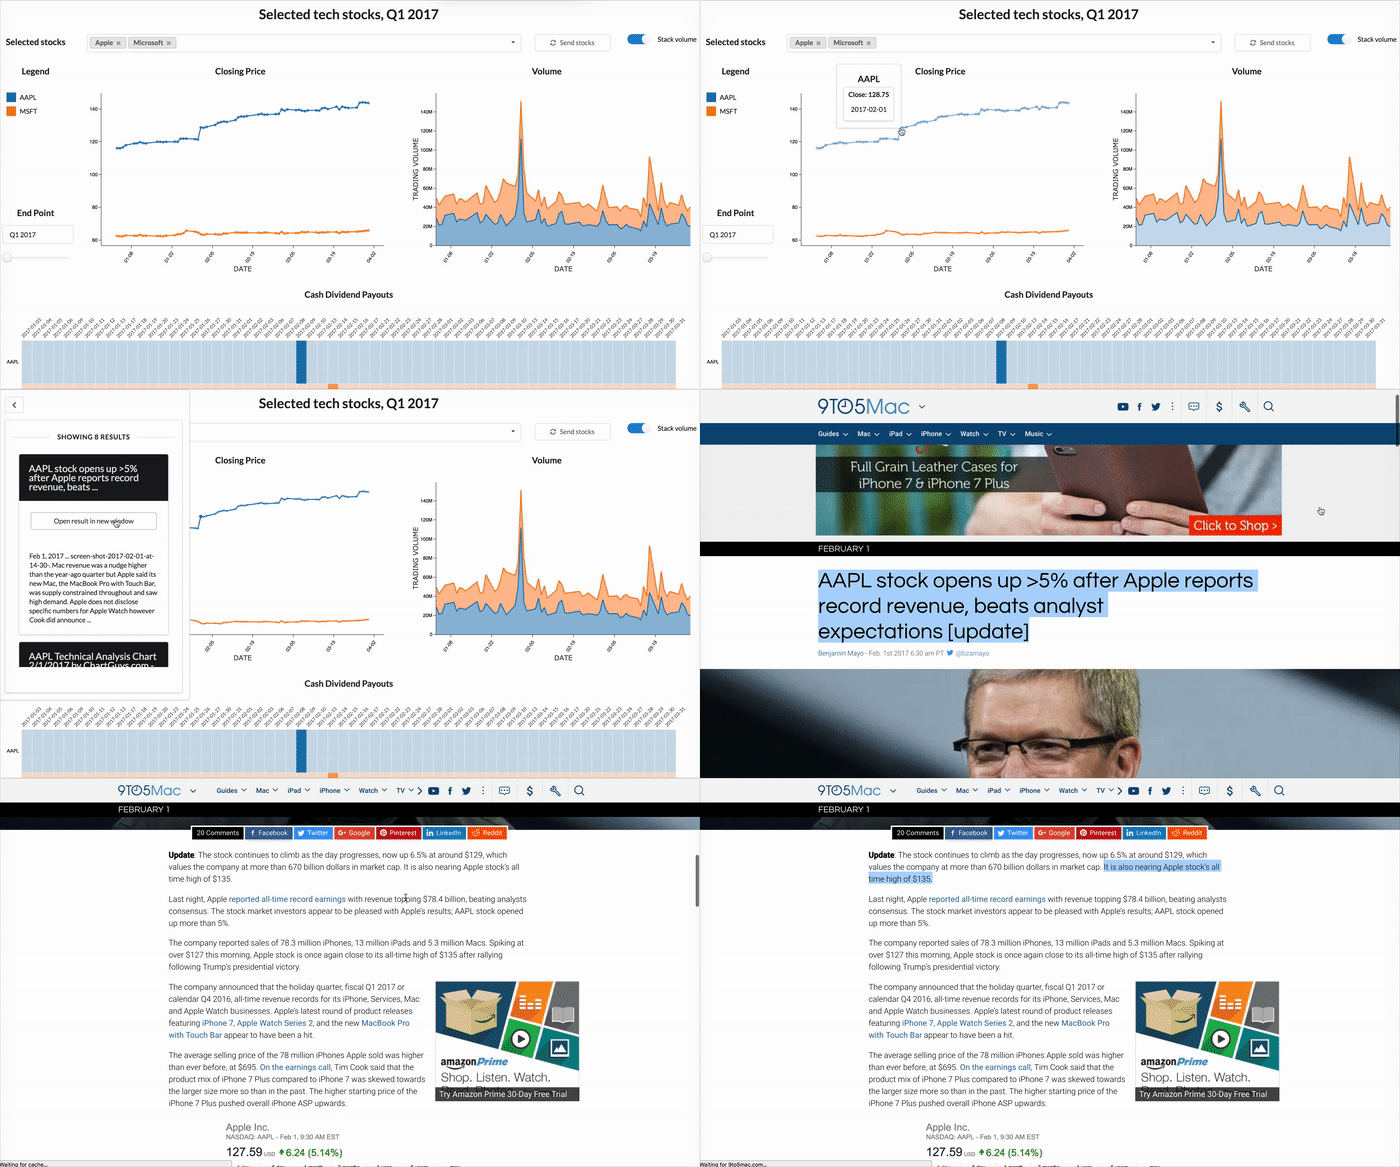
A crucial aspect that sets a data application apart from an ordinary visualization is interactivity. In an application, visualizations can interact with each other. For example, clicking on a point in a scatterplot may send corresponding data to a table. In an application, visualizations are also enhanced with simple filtering tools, e.g. selections in a list can update results shown a heat map.
You can already try some linked visualizations to find the perfect taco. Now, we'll look at how some simple filtering elements enhance visualization, using a tech stock exploration xap I built over a couple of days. (A xap is what we call a data application built with the Exaptive Studio.) A few simple, but flexible interactive elements can help transform ordinary visualizations into powerful, insightful data applications. Humble check boxes and lists help produce extra value from charts and plots.
Read More »Finding Netflix's Hidden Trove of Original Content with a Basic Network Diagram
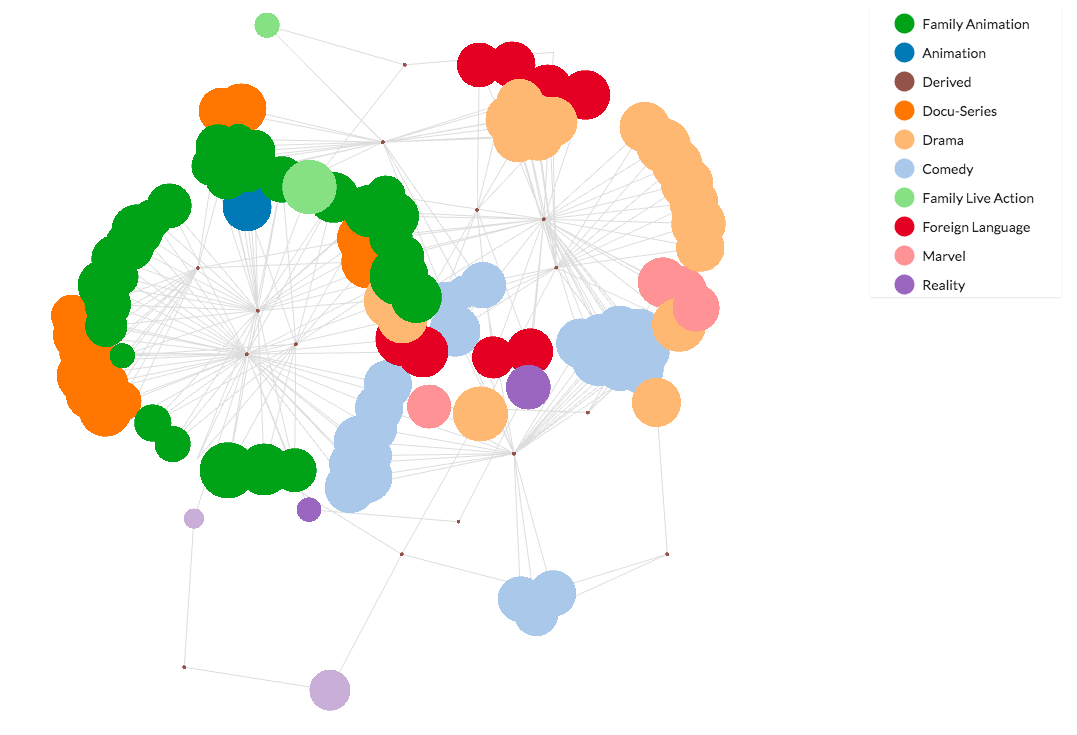
Nexflix has collected an impressive amount of data on Hollywood entertainment, made possible by tracking the viewing habits of its more-than 90 million members. In 2013, Netflix took an educated guess based on that data to stream its own original series, risking its reputation and finances in the process. When people were subscribing to Netflix to watch a trove of television series and movies created by well-established networks and studios, why create original content? Now, few would question the move.
Read More »A Data Application for the _______ Genome Project
The ability to reuse and repurpose - exaptation - is often a catalyst for exciting breakthroughs. The Astronomical Medicine Project (yes, astronomical medicine) was founded on the realization that space phenomena could be visualized using MRI software, like highly irregular brains. The first private space plane, designed by Burt Ratan, reenters the atmosphere using wings inspired by a badminton birdie. Anecdotes like this abound in many fields, and the principle applies to working with data and creating data applications, as much as it does any innovation.
To demonstrate and give our users a running start at successfully repurposing something, we want to share an editable data application, the Taco Cuisine Genome Atlas. We held an internal hackathon in which teams had a day to design and build a xap. (A xap is what we call data application built with our platform. Learn a bit more about our dataflow programming environment here.) One team took algorithms and visualizations created for a cancer research application and applied them to tacos. Application users can identify, according to multiple ingredients, specific tacos and where to find them.
The best part is that this wasn't entirely an act of frivolity. Repurposing healthcare and life sciences tools on different, albeit mundane, data led to a potential improvement for the cancer research application - a map visualization of clinical trials for specific cancer types.
It can't be said enough. New perspective is a key catalyst for innovation.
So, we've made this xap available for the public to kickstart other work. Explore it, build off it, and apply it to your own data.
Read More »

