Tools to Foster Well-Functioning Communities
How We Help
When your community is focused on a specific goal, spreadsheets and social media groups implode with complexity and don’t provide an accurate picture of what's happening.
Exaptive's software keeps your network's information organized to make sure everyone gets what they need and it helps you implement the activities needed to create continuous positive change from within.
Our Products Coordinate Complex Communities

The Exaptive Studio
Create a simple, explorable, data-driven model of your problem.

The Cognitive City®
Find hidden conection opportunities and facilitate conversation.
Case Studies in Innovation Management
Steve Kern, Deputy Director - Quantitative Sciences

Michelle Zucker, Director - Community Activation
Features and Capabilities
Exaptive Studio
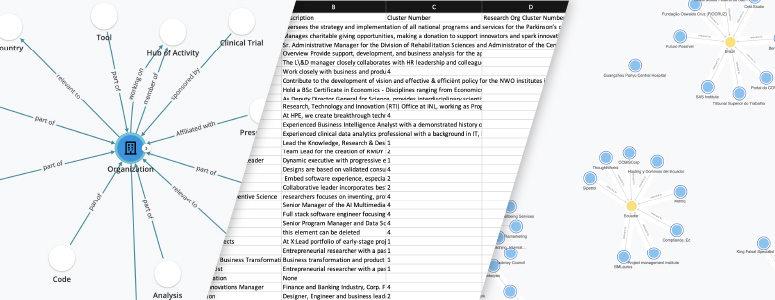
Model the people, things, relationships, forces, events, etc. (left) within your network with no-code tools and then import data from spreadsheets (center) or enter it directly. Visualize your community immediately with the exploratory network viewer (right) or as connected tables.
- Solidify your understanding of how people and things are connected
- Import data from spreadsheets
- Keep your data organized
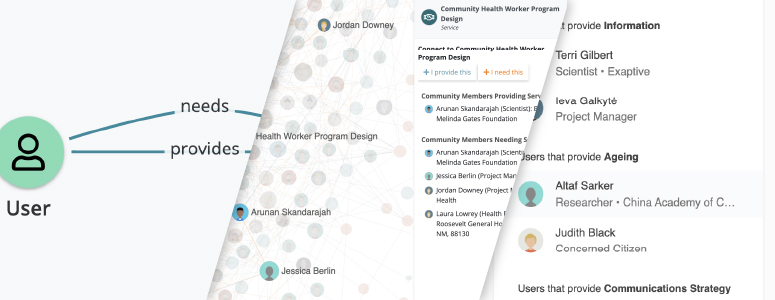
Model the things people need and provide in your community (left) to create a searchable network (center) that can be used to leverage your existing resources to fill unmet needs. In a City with users engaging directly with each other you can surface relevant collaborations/connections based on the needs they add to their profiles (right).
- Find unmet needs and underused resources
- Publish and share your views
- Find and create key connections
- Export clean data as needed
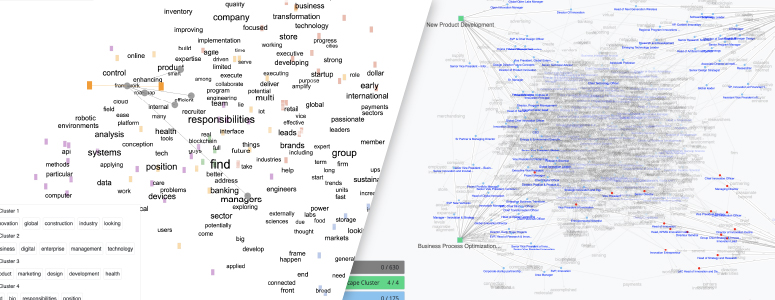
Descriptions and narratives can be viewed instantly in interactive visualizations that illuminate connections hidden in the data (left). As the hidden concepts that connect things emerge you can make permanent connections that help people easily find things based on what you learned (right).
- Use unstructured text from bios, narratives, and descriptions to figure out if people may be using different words when talking about the same thing
- Create teams or sets of resources optimized to solve specific problems and be certain about making decisions by quantifying how well each possible combination works
Exaptive Cognitive City
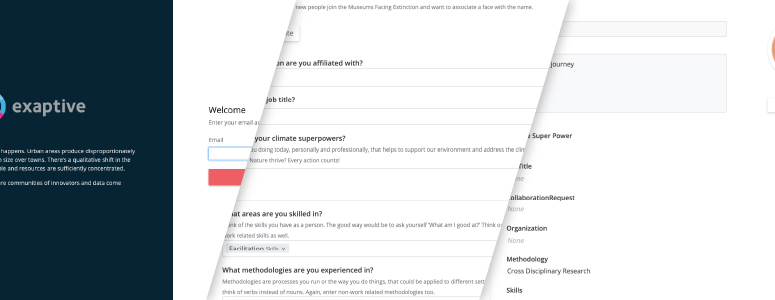
Brand the Cognitive City as your own and convey goals to the community from the first login (left). Create custom forms for people to create helpful profiles for themselves and their organizations (center). Members can update their profile and control their account at any time (right).
- Create a cohesive space
- Reinforce goals
- Create a safe and inclusive community
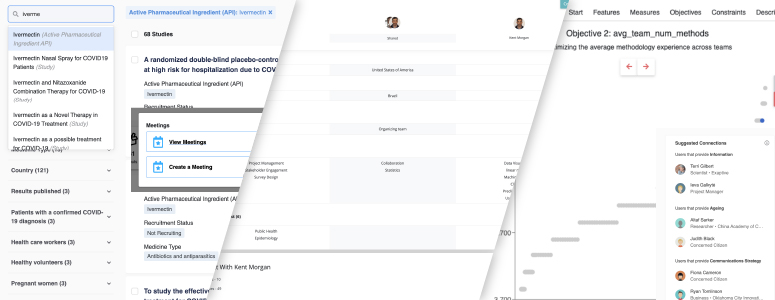
Create custom search tools (left) to help people find relevant knowledge and capabilities available in the community and help people create inclusive conversations that solve problems within the community (left-center). Built in collaboration tools help people see how they overlap and safely reach out to collaborate (center). The matchmaker helps you generate suggested teams and collaborations for solving specific problems (right).
- Enable sharing and self-service collaboration
- Incentivize entrepreneurial behaviors
- Create and activate influencers
- Enable catalytic activities
- Facilitate non-obvious collaborations
- Engage stakeholders
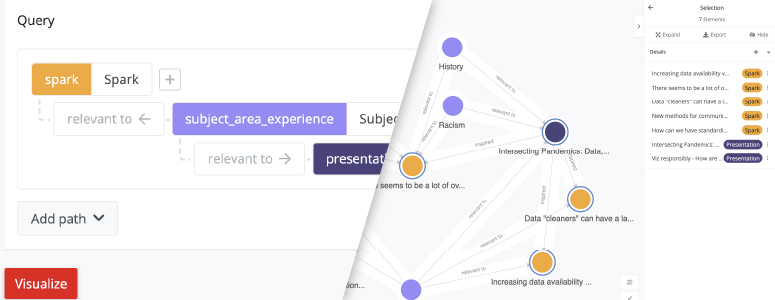
As your innovation plans play out, like making recorded presentations findable and watchable to your community, the knowledge captured in the graph database can be analyzed for specific patterns (left) to understand which activities are producing ideas and how. Patterns of engagement, like people sharing insights they found from connecting different presentations they observed (right), can be easily identified and used to improve and adjust your efforts.
- Create custom engagement metrics
- Find and promote the drivers of productive conversation
- Identify and replicate good examples of positive-change