Blog

Matthew Schroyer

Matthew Schroyer

Matthew Schroyer is a Front End Developer with diverse interests. Matt has a background in data journalism, in particular drone-based journalism. He founded the Professional Society of Drone Journalists. And he has spoken at SXSW, IEEE ISTAS, NSF LNC, and NARST, and for numerous media outlets about around the globe about drone journalism and citizen data science.
Find me on:

Recent Posts

Exploring Tech Stocks: A Data Application Versus Data Visualization

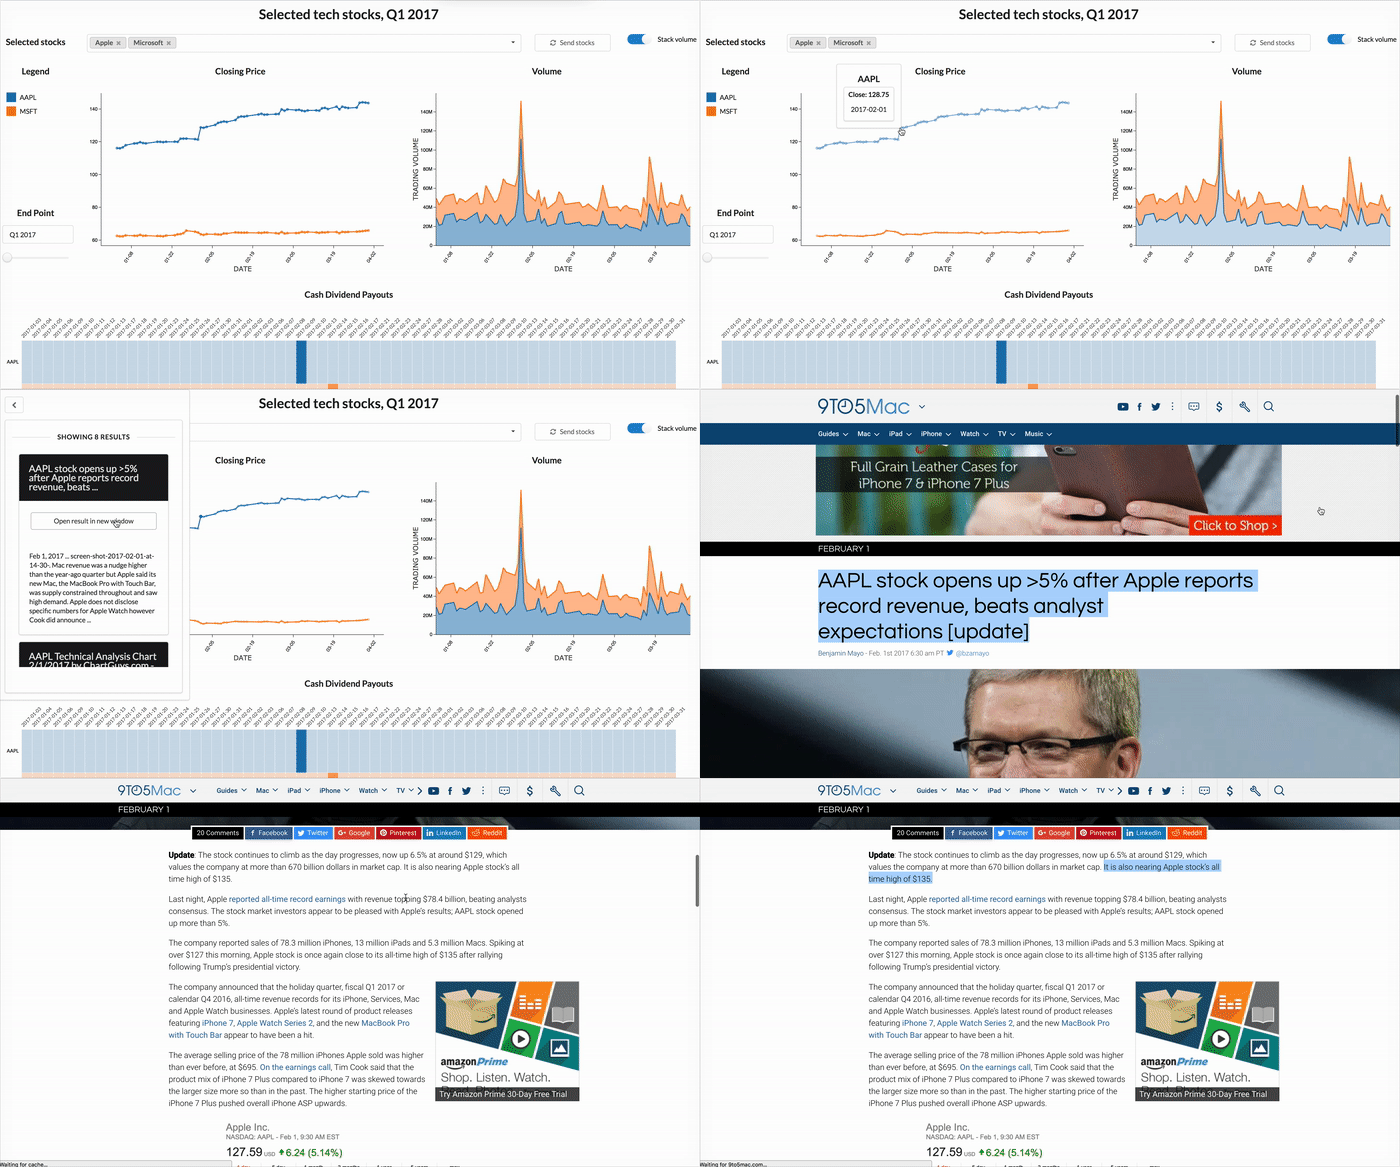
A crucial aspect that sets a data application apart from an ordinary visualization is interactivity. In an application, visualizations can interact with each other. For example, clicking on a point in a scatterplot may send corresponding data to a table. In an application, visualizations are also enhanced with simple filtering tools, e.g. selections in a list can update results shown a heat map. 

You can already try some linked visualizations to find the perfect taco. Now, we'll look at how some simple filtering elements enhance visualization, using a tech stock exploration xap I built over a couple of days. (A xap is what we call a data application built with the Exaptive Studio.) A few simple, but flexible interactive elements can help transform ordinary visualizations into powerful, insightful data applications. Humble check boxes and lists help produce extra value from charts and plots.

Read More »
Finding Netflix's Hidden Trove of Original Content with a Basic Network Diagram

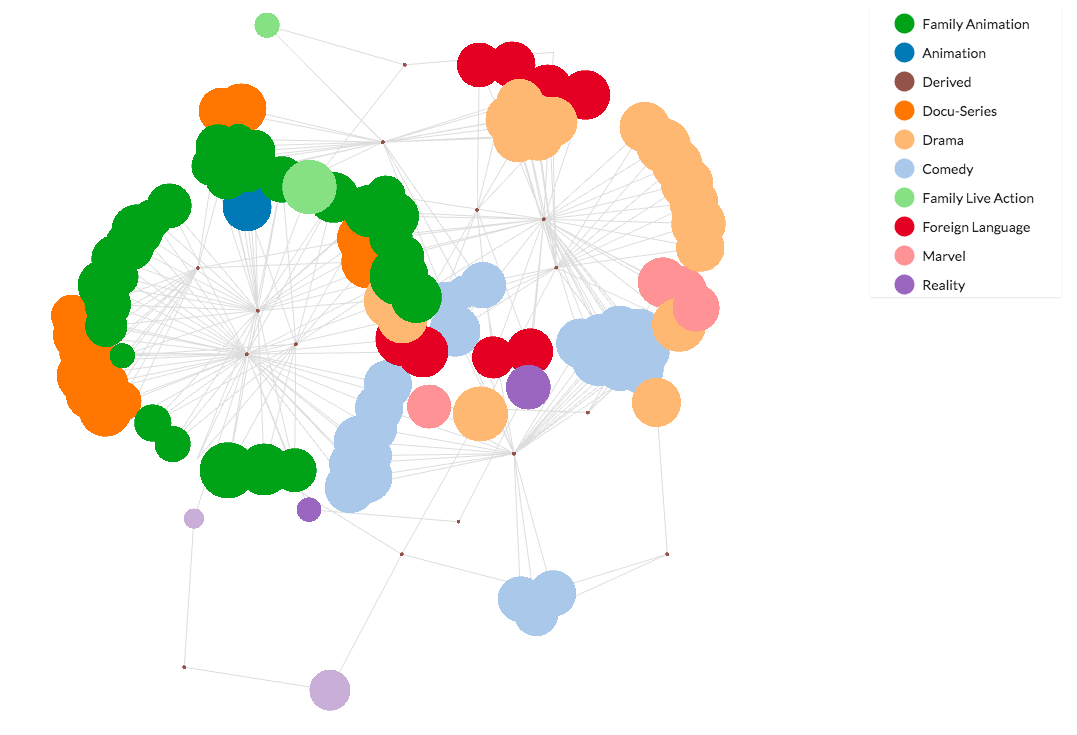
Nexflix has collected an impressive amount of data on Hollywood entertainment, made possible by tracking the viewing habits of its more-than 90 million members. In 2013, Netflix took an educated guess based on that data to stream its own original series, risking its reputation and finances in the process. When people were subscribing to Netflix to watch a trove of television series and movies created by well-established networks and studios, why create original content? Now, few would question the move.

Read More »
1