Blog

A Data Application to Foretell the Next Silicon Valley?

Can we predict what the next hub of tech entrepreneurship will be? Could we pinpoint where the next real estate boom will be and invest there? Thanks to advances in machine learning and easier access to public data through Open Data initiatives, we can now explore these types of questions.

Read More »

Data Science Wanderlust: Analyzing Global Health with Protein Sequences

Fifteen years ago, I had the unique opportunity to go on Semester at Sea, an around-the-world trip on a converted cruise ship that combined college coursework stops at nine countries on four continents. This once in a lifetime trip instilled in me a strong sense of wanderlust and a deep desire to give back to the global community.

Every Journey Begins with a Single Step

Fast-forward to a few months ago, when I joined Exaptive on an exciting new project. A large NGO enlisted us to analyze a massive set of historical data for countries. The goal: to develop a better, more granular means of grouping countries than the outdated and crude approach of "developed" and "developing." This large, complex, messy dataset and thorny problem were a great fit for my background in artificial intelligence and data science.

Read More »

Affecting Change Using Social Influence Mapping

If you've ever tried to get a company to adopt new software you know how challenging it can be. Despite what seem to you like obvious benefits and your relentless communication, people selectively ignore or, worse, revolt against the change. Change efforts will even stumble in the face of this wisdom of the ages:

Read More »

Exploring Tech Stocks: A Data Application Versus Data Visualization

A crucial aspect that sets a data application apart from an ordinary visualization is interactivity. In an application, visualizations can interact with each other. For example, clicking on a point in a scatterplot may send corresponding data to a table. In an application, visualizations are also enhanced with simple filtering tools, e.g. selections in a list can update results shown a heat map. 

You can already try some linked visualizations to find the perfect taco. Now, we'll look at how some simple filtering elements enhance visualization, using a tech stock exploration xap I built over a couple of days. (A xap is what we call a data application built with the Exaptive Studio.) A few simple, but flexible interactive elements can help transform ordinary visualizations into powerful, insightful data applications. Humble check boxes and lists help produce extra value from charts and plots.

Read More »

Finding Netflix's Hidden Trove of Original Content with a Basic Network Diagram

Nexflix has collected an impressive amount of data on Hollywood entertainment, made possible by tracking the viewing habits of its more-than 90 million members. In 2013, Netflix took an educated guess based on that data to stream its own original series, risking its reputation and finances in the process. When people were subscribing to Netflix to watch a trove of television series and movies created by well-established networks and studios, why create original content? Now, few would question the move.

Read More »

A Data Application for the _______ Genome Project

The ability to reuse and repurpose - exaptation - is often a catalyst for exciting breakthroughs. The Astronomical Medicine Project (yes, astronomical medicine) was founded on the realization that space phenomena could be visualized using MRI software, like highly irregular brains. The first private space plane, designed by Burt Ratan, reenters the atmosphere using wings inspired by a badminton birdie. Anecdotes like this abound in many fields, and the principle applies to working with data and creating data applications, as much as it does any innovation. 

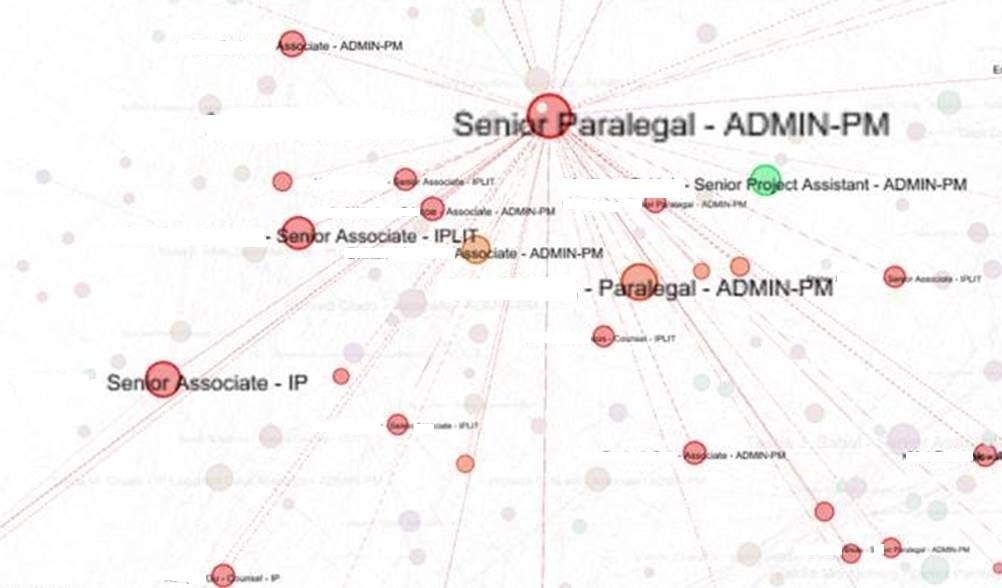
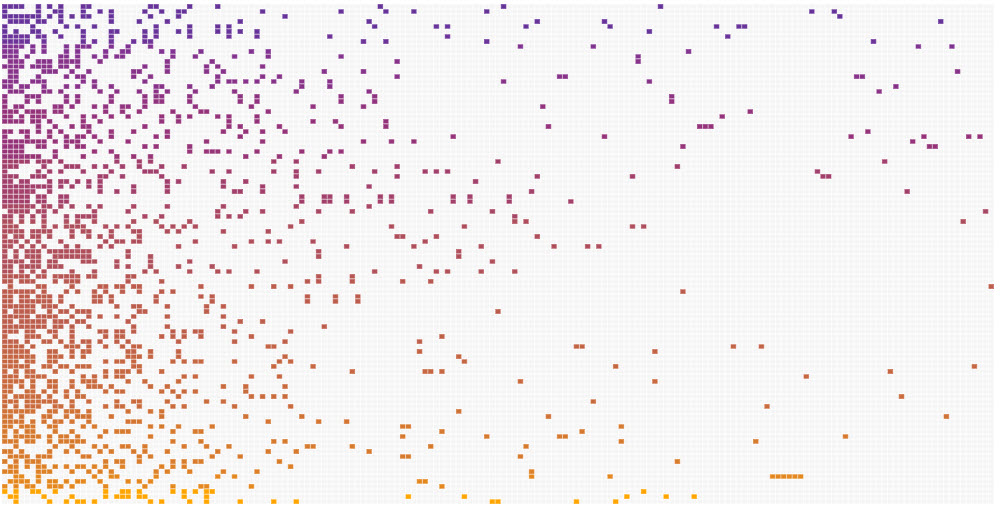
To demonstrate and give our users a running start at successfully repurposing something, we want to share an editable data application, the Taco Cuisine Genome AtlasWe held an internal hackathon in which teams had a day to design and build a xap. (A xap is what we call data application built with our platform. Learn a bit more about our dataflow programming environment here.) One team took algorithms and visualizations created for a cancer research application and applied them to tacos. Application users can identify, according to multiple ingredients, specific tacos and where to find them.

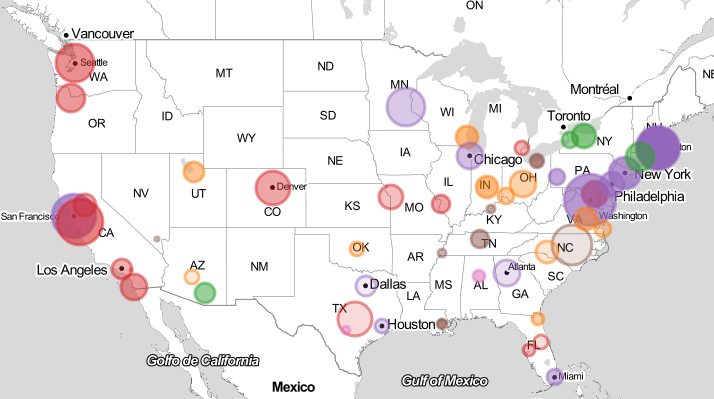
The best part is that this wasn't entirely an act of frivolity. Repurposing healthcare and life sciences tools on different, albeit mundane, data led to a potential improvement for the cancer research application - a map visualization of clinical trials for specific cancer types. 

It can't be said enough. New perspective is a key catalyst for innovation. 

So, we've made this xap available for the public to kickstart other work. Explore itbuild off it, and apply it to your own data. 

Read More »

Text Analysis with R: Does POTUS Write the State of the Union or Vice Versa?

In this post, I apply text clustering techniques – hierarchical clustering, K-Means, and Principal Components Analysis – to every presidential state of the union address from Truman to Obama. I used R for the setup, the clustering, and the data vis.

It turns out that the state of the union writes the State of the Union more than the president does. The words used in the addresses appear linked to the era more than to an individual president or his party affiliation. However, there is one major exception in President George W. Bush, whose style and content marks a sharp departure from both his predecessors and contemporaries. You can see the R scripts and more technical detail on the process here. The State of the Union addresses up to 2007 are available here and the rest you can get here.

Read More »

Cowboys and Inventors: The Myth of the Lone Genius

I recently moved from Boston to Oklahoma City. My wife got offered a tenure-track position at the University of Oklahoma, which was too good an opportunity for her career for us to pass up. Prior to the move, I had done a lot of traveling in the US, but almost exclusively on the coasts, so I didn't know what living in the southern Midwest would bring, and I was a bit trepidatious. It has turned out to be a fantastic move. There is a thriving high-tech startup culture here. I've been able to hire some great talent out of the University, and we're now planning to build up a big Exaptive home office here. Even more important, I was delighted to find a state that was extremely focused on fostering creativity and innovation. In fact, the World Creativity Forum is being hosted here this week, and I was asked to give a talk about innovation. As I thought about what I wanted to say, I found myself thinking about . . . cowboys.

Read More »

The Data Scientific Method

The Oxford English Dictionary defines the scientific method as "a method or procedure that has characterized natural science since the 17th century, consisting in systematic observation, measurement, and experiment, and the formulation, testing, and modification of hypotheses." With more scientists today than ever, the scientific method is alive and well, and generating more data than ever. This explosion of data has brought about the field of data science and an associated plethora of analytics tools. Controversially, some have claimed, such as in this Wired magazine article, that data science is so powerful that it has made the scientific method obsolete. Google's founding philosophy is that “we don't know why this page is better than that one. If the statistics of incoming links say it is, that's good enough.” The implication is that with enough data, people will no longer need to know why something happens, it just does, and that’s good enough. Is it, really?

Read More »

We work on Technology. Then it works on us.

I think I was 10 years old when my dad brought home our first microwave oven. It was an imposing black box that weighed a ton and had scary warning labels that mentioned radiation. The only time I had ever heard mention of radiation before was in regard to the atom bomb. We felt like we were supposed to run for cover whenever we turned it on, but, like everyone else I knew who had one, we did just the opposite. We huddled around it. We brought our noses right up to the translucent window, and watched, mesmerized in wonder, as the food inside got zapped by mysterious, limitless, invisible energy. When the timer beeped, and the door opened to reveal a steaming bowl of soup that had been cold only a minute ago, it seemed like a miracle. I remember those early days with the microwave vividly – experimenting with eggs, and chocolate syrup, and the off-limits gold-rimmed fine china that would send off an awe-inspiring barrage of orange sparks after just 15 seconds. Just 15 seconds! 15! I think that was the most important thing of all about the microwave oven – not what it did to my food, but what it did to my sense of time.

Read More »
1