
My new year's resolution was to do more blogging and in January I wrote a blog about 12 things related to data, people, projects, and innovation that I believe we need to approach differently. The very first item in my 12 item list included the statement: "We need to shift away from thinking of our data as individual tables and towards realizing its one big network. We need to mine it not by building lists but by making maps."
In this blog I'd like to delve more deeply into what I meant by that and invite you to try the first step of building your own map. If you decide to enter the "mental model challenge" you can win some cool Exaptive swag and tickets to the ISPIM innovation conference in Copenhagen in June that you can join either physically or virtually! Even if you don't win, I think you'll find the exercise illuminating, so I hope you'll try it.
When I talk about networks I use the word "graph", which is just another word for a network of nodes and edges, where "edges" is just the term for the links between nodes. Over the last decade there has been a lot of buzz about graphs, and you've likely heard terms like "knowledge graph" or "graph database". Even those these words have been in use for a long time I find that many people are still wondering, "What really is a graph? How is it different than a table? And why should I care?". I care about the difference a lot, so my goal in this blog is to help you understand this difference too, and hopefully see that many of the problems that you're wrestling with are likely, in one way or another, graph problems.
Generally, we are familiar with storing information in rows and columns, which works for a lot of things, and for the most part, you will never need another alternative. But when you start to see the weaknesses, you also start to see the importance of having another option. Let’s explore what I mean…
Imagine that you are a teacher and you want to store information about your students and their parents. Easy, you open up a spreadsheet and create some columns for the Students' and their parents' names:
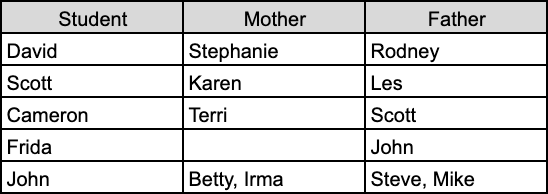
You start running into issues when you confront real world realities, such as “Does Frida not have a mother? Or just doesn’t know who her mother is?”. This is the problem of nulls and is problematic as it leaves you with a question about the completeness of the data.
Then, when you start to confront John’s situation, you might be able to guess that his biological parents divorced and remarried, but you have already lost information: “Is Betty married to Steve? Or Mike? And who is the biological mother and father?” This is an issue of multiple values for the same category, and will always obscure the reality of the situation.
Most of these issues you have probably already run into, and they don’t necessarily occur as so problematic that you should just abandon the whole system.
It is only once you confront the third problem, that of the “fragile schema” that you may start to look for an alternative. The fundamental hidden assumption that is implicit in this spreadsheet is that of a student having a mother and a father - and that assumption is based on a hetero-normative paradigm. There's nothing wrong with hidden assumptions - all our models have them - the problem is when we can't easily evolve our model to accommodate data that doesn't fit those assumptions, like Anne:
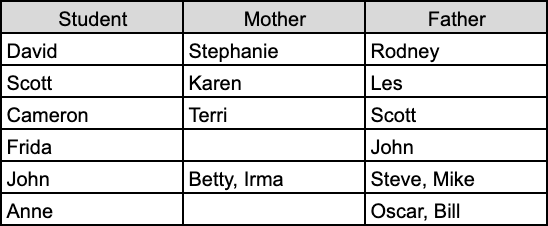
Anne has two dads for an entirely different reason than John, her gay dads adopted her.
The spreadsheet has now diverged far enough from the reality of present-day parenting that it not only doesn’t reflect it anymore, but it starts to become unusable as a tool. Our models are always imperfect representations of reality, so what's important is that they are easy to evolve as we learn more about the nuance of the reality we're trying to model. A spreadsheet (or database) tries to constrain everything as a set of rows and columns which creates a schema (data model) that is extremely fragile. But a schema needs to be resilient so that learning new things is an asset, not a liability. Look at how making your model a graph instead of a table makes this easier:
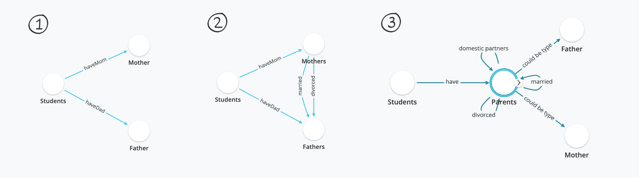
First we thought each student had one mother and one father (1), then we realized that they could have multiple mothers and fathers due to divorce and remarrying (2), then we realized that same-sex domestic partners adopting might make it more accurate to introduce the more general concept of "parents" which can be connected to each other in different ways and be of different types like "mother" and "father" (3). This third model is not only more representative of present reality, but more scaleable to include additional dynamics that might become important to include as we collect even more data.
This is the beauty of flexible modeling - that you can keep going, unafraid to keep shifting the model as you learn more nuance. This mode of modeling also makes it easier to talk about your model and the assumptions built into it, and learn from others who might see things slightly differently. The third benefit of this approach is that you're building the model before you're putting data into it. With spreadsheets we tend to build the model in the act of entering data, which tends to conflate our mental model with our data model. The good news about graphs is that when it comes to entering data this is extremely flexible too:
Knowledge graphs capture their data as sets of three word sentences: subject - predicate - object.
For example, the spreadsheet above can be converted from rows and columns into the following three-word sentences:
Dave hasMom Stephanie
Dave hasDad Rodney
Scott hasMom Karen
Scott hasDad Les
Cameron hasMom Terri
Cameron hasDad Scott
Frida hasDad John
John hasMom Betty
John hasMom Irma
John hasDad Steve
John hasDad Mike
Anne hasDad Bert
Anne hasDad Ernie
Notice how this avoids ambiguous nulls and doesn't overload fields. If Frida doesn’t have a mom, then there is just no sentence for it. If John and Anne have multiple moms and dads, you just add sentences. If you have heard the term "semantic data" - here it is. There's no secret to semantic data, it's just data that can be read like a sentence with meaning. And it turns out that the smallest sentence structure that can convey lots of meaning is of the three-word form subject-predicate-object.
Once you model your situation as a graph, and load some semantic data into your graph model, you can navigate and ask questions of your data that are often hard to ask in more traditional table-based systems. This is because one of the best parts of a knowledge graph is that you can encode metadata alongside the data in the same three word format. You can easily clear up who is married to whom by just adding more sentences:
Betty marriedTo Mike
Irma marriedTo Steve
And as we evolve our data model from a heteronormative model to one that reflects the reality of gay marriage, we also add:
Oscar marriedTo Bill
Now, we can incorporate ontology, which allows us to incorporate the ability to reason about the data and infer new information from existing data, all in the same three word format. For example, by adding the sentence
marriedTo is Reciprocal
We can now infer that Bill is also married to Oscar, even though the data does not explicitly state that. This is where people confuse Ontology with Taxonomy. A taxonomy is a classification - it lets you organize information but it doesn't let you infer new information. An ontology lets you infer. For example, gender is a taxonomy. We can add:
Dave gender Male
Scott gender Male
Cameron gender Male
Sydney gender Female
Frida gender Female
Etc
This additional data lets us organize people by gender but it doesn’t let us infer new information. Ontological statements, on the other hand, allow for inference, for example:
marriedTo differentGenders heterosexualCouple
marriedTo sameGenders homosexualCouple
Member of heterosexualCouple isStraight
Member of homosexualCouple isGay
With these four sentences, we can now infer something about all the couples in the data even though we haven’t explicitly added any new data about those couples. I can now figure out that Oscar and Bill are a homosexual couple and every other couple is heterosexual. Except the jury is still out on Frida because we only have info about one parent. The key here is that with gender (taxonomy), we added a sentence about gender for each person but with sexuality (ontology) we added nothing about the people (I didn’t say "Oscar orientation Gay" or "Rodney orientation Straight"). I just added something about the definition of marriage and then can infer sexual orientation as a result. I can then use sexual orientation to organize and categorize my data - that is, use it as a part of a taxonomy - but it’s a taxonomical variable derived from an ontological set of statements.
Here is the main takeaway from all this:
I've used the fairly charged example of marriage and homosexuality because it reflects the essence of the problem with data modeling. At one point in time you think the world works a certain way. In the 1970s mostly no one was worried about modeling marriage as anything other than a man and a woman. We then built huge systems based on that world view. The question then becomes, what happens when our world view changes? What happens when we acknowledge gay marriage? Usually what happens with a paradigm shift like that is that all our systems break. Relational databases certainly do. Rows and columns can’t adjust to a new world view because the rows and columns are the world view. And the stakeholders involved in these systems aren't so resilient either. As the systems they have built start to crack, not only are the owners of those systems lacking the tools to quickly fix them, but they are also lacking the tools to reconcile their newly cracked models with the newly cracked models of others to collaboratively build a new more resilient shared model.
Perhaps a more insidious but worthy inquiry is to reflect on how the tools we use to visualize our models, with their imperfections, start to become our reality. Then they constrain our future. Imagine an architect with a desire and the imagination to build organic buildings that disappear into the environment around them, but the only tool she has is autocad. Models that limit your thinking to rectangles, will become your reality and the architecture of our world becomes mostly that of stacked boxes. Relying on a fragile schema for fundamental views of the world is less than optimal. A knowledge graph, without the fragile schema problem, adjusts just fine as it more accurately represents our view of the world, and it can be modified as our views evolve.
And that is the beauty of a knowledge graph - you can change things simply through additions of more sentences. As your understanding of the world expands, you just add more sentences and the knowledge graph just “keeps up”. There is no fragile schema.
Want to try your hand at putting this theory to the test? Take one of your projects, or a phenomenon you are particularly interested in, and model it as a graph as opposed to rows and columns. We're offering a free version of the Exaptive Studio to those that want to try this out, and a cool Innovation Package award, (including a ticket to the upcoming ISPIM Copenhagen Innovation Conference in June) to the most thought-provoking model submitted. I dare you to try out our mental model challenge and tell me it doesn't change, in some meaningful way, how you think about your topic of interest!
Comments