
Some of the most satisfying breakthroughs happen when technology gets used in a way it was never intended. While working with our graphic design group at Sasaki on ways to generate a dot pattern for a decorative screen, we came across some open-source software called StippleGen. Stippling is a way of creating an image by means of dots. StippleGen was created to optimize stippling for, among other things, egg painting. The software does a great job of laying out dots with greater density on the darker areas of the image while keeping a comfortable spacing between the dots. What's more, the voronoi algorithm it uses gives an irregular, organic pattern. The ah-ha moment came when I realized this could be applied to a different problem, visualizing terrain; specifically, optimizing terrain meshes in 3D software based off elevation data (a.k.a. Digital Elevation Model (DEM)).
Here's a typical use of StippleGen:
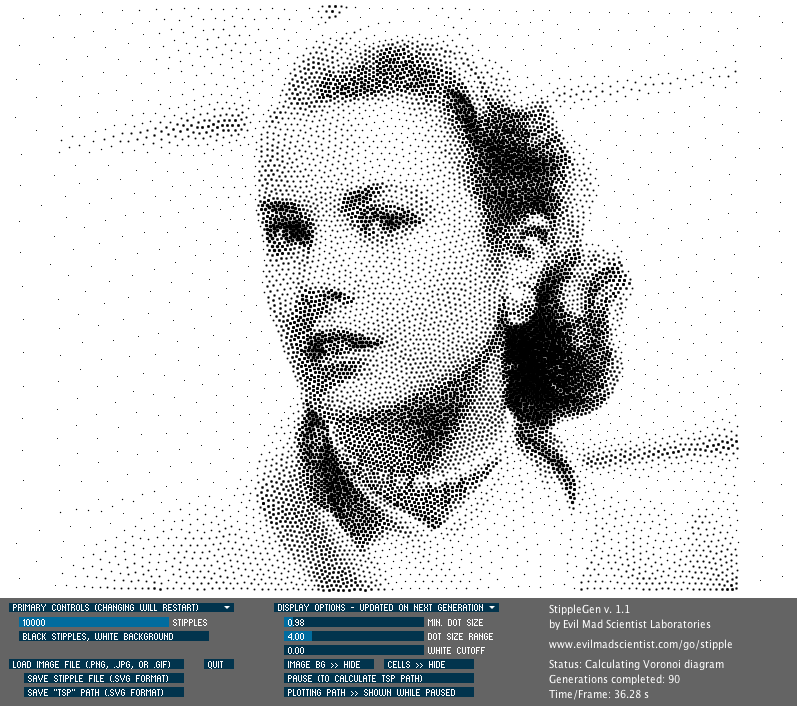
(Image from http://www.evilmadscientist.com/2012/stipplegen-weighted-voronoi-stippling-and-tsp-paths-in-processing/)
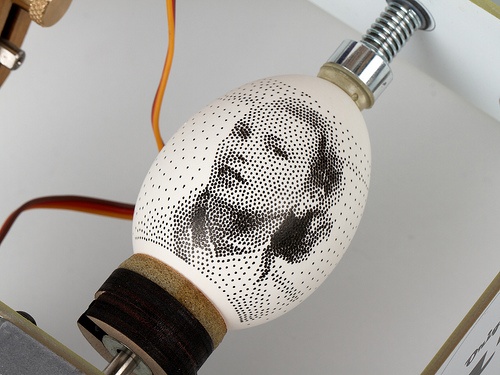
(Image from http://wiki.evilmadscientist.com/StippleGen)
So how do we get from eggs to terrain? A given terrain, unlike an egg, is typically a mix of high variation areas, like canyons, with more uniform areas, like plains or plateaus. A typical DEM heightmap can be seen in the following image (top left) alongside some more familiar, human-readable representations of the same terrain that you might see on maps. Shaded relief is a useful trick for representing terrain in 2D where the terrain appears to be lit from one side.
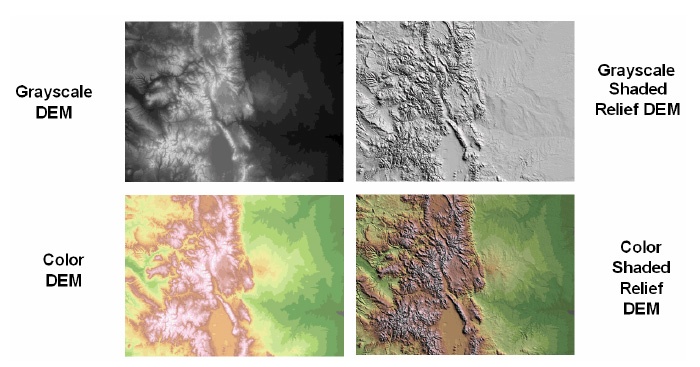
(Image from: https://trac.osgeo.org/ossim/attachment/wiki/ossim-chipper/dem.jpg)
While shaded relief is an effective way of representing terrain for maps (from directly above) it is insufficient for 3D representations like those you might find in CAD software, virtual reality or video games. The challenge with generating 3D mesh images from heightmaps is that the heightmaps typically contain significantly more information than you can capture in a 3D mesh without blowing up the polygon count and slowing down your frame rate to the point where smooth animation or manipulation in realtime becomes impossible even with high powered GPUs. A variety of sophisticated algorithms exist for optimizing meshes, but they can be time-consuming and require specialized tools that are hard to generalize across multiple workflows.
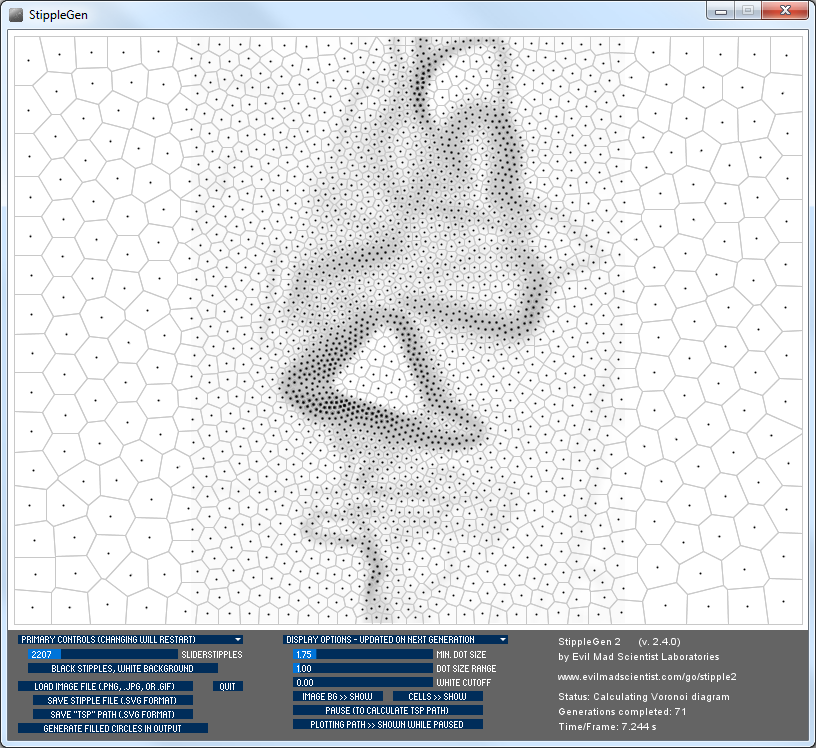
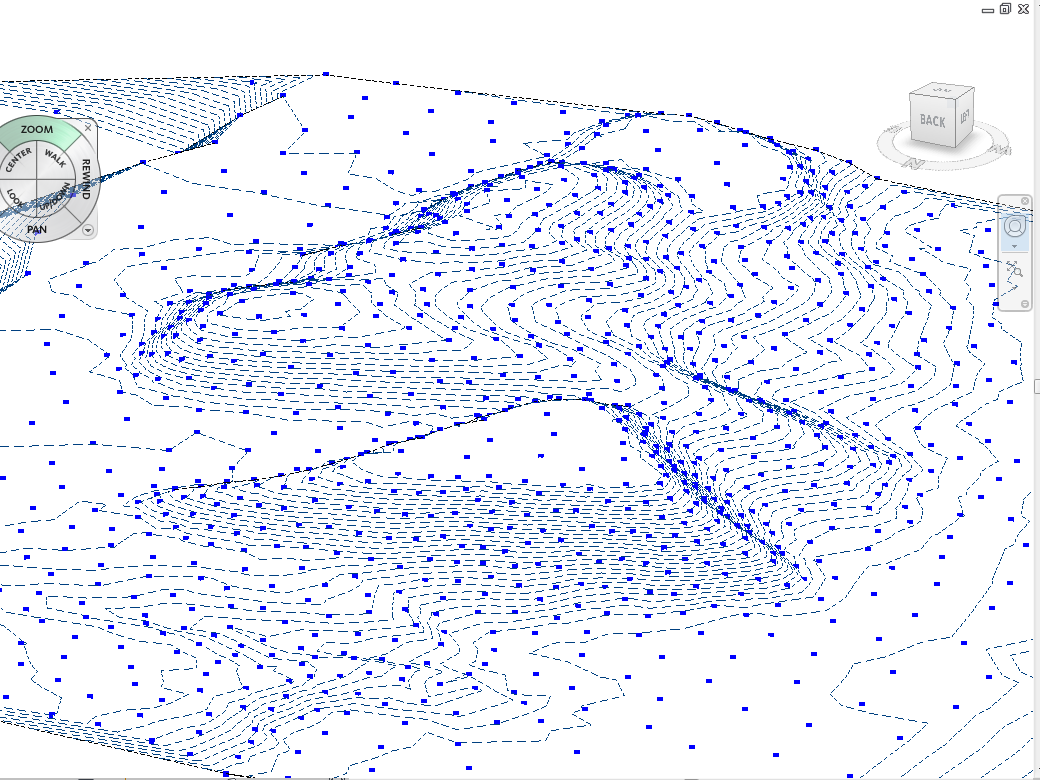
What we realized was that we could use the open source StippleGen tool and modify it to take in both a heightmap as well as as a variance map (an image using darker grays to represent those areas with the greatest variation in the heightmap). This crowded the dots in the areas of greatest variation resulting in more detail where we wanted it. We could also control the density and level of detail of the resulting mesh using a slider. What's more, the organic quality of the dot distribution also helped reduce the bias imposed by a regular grid where details could fall between the cracks.
The result is a tool that provides a highly optimized 3D mesh for use in everything from Autodesk Revit, 3D Studio Max, Rhino, SketchUp, Unity or WebGL. All from a tool created for decorating eggs! A technological exaptation!
Here's our terrain data in StippleGen using a variance map to concentrate the dots where we want them:
Comments