Blog

How Data Visualization Supports the Formation of Better Hypotheses

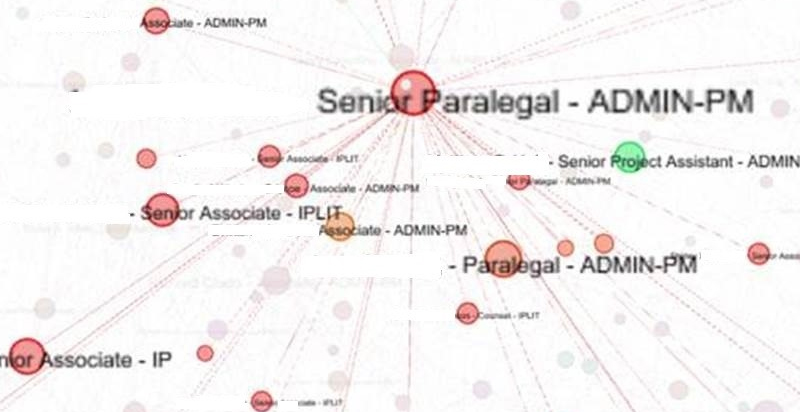
Since Exaptive launched in 2011, we’ve worked with many researchers, particularly in medicine and the natural sciences. PubMed®, a medical journal database, pops up repeatedly as a key tool for these researchers to develop hypotheses. It’s a tool built in a search-and-find paradigm with which we’re all familiar. Execute a keyword search. Get a list of results. Visualization can make search - and, therefore, research - much more meaningful.

Read More »

Machine Learning Helps Humans Perform Text Analysis

The rise of Big Data created the need for data applications to be able to consume data residing in disparate databases, of wildly differing schema. The traditional approach to performing analytics on this sort of data has been to warehouse it; to move all the data into one place under a common schema so it can be analyzed.

Read More »

How a Data Scientist Built a Web-Based Data Application

I’m an algorithms guy. I love exploring data sets, building cool models, and finding interesting patterns that are hidden in that data. Once I have a model, then of course I want a great interactive, visual way to communicate it to anyone that will listen. When it comes to interactive visuals there is nothing better than JavaScript’s D3. It’s smooth and beautiful.

Read More »

Topic Modeling the State of the Union: TV and Partisanship

Do you feel like partisanship is running amok? It’s not your imagination. As an example, the modern State of the Union has become hyperpartisan, and topic modeling quantifies that effect. 

Read More »

Affecting Change Using Social Influence Mapping

If you've ever tried to get a company to adopt new software you know how challenging it can be. Despite what seem to you like obvious benefits and your relentless communication, people selectively ignore or, worse, revolt against the change. Change efforts will even stumble in the face of this wisdom of the ages:

Read More »

Text Analysis with R: Does POTUS Write the State of the Union or Vice Versa?

In this post, I apply text clustering techniques – hierarchical clustering, K-Means, and Principal Components Analysis – to every presidential state of the union address from Truman to Obama. I used R for the setup, the clustering, and the data vis.

Read More »
1

    Recent Posts

    Subscribe