
In this post, I apply text clustering techniques – hierarchical clustering, K-Means, and Principal Components Analysis – to every presidential state of the union address from Truman to Obama. I used R for the setup, the clustering, and the data vis.
It turns out that the state of the union writes the State of the Union more than the president does. The words used in the addresses appear linked to the era more than to an individual president or his party affiliation. However, there is one major exception in President George W. Bush, whose style and content marks a sharp departure from both his predecessors and contemporaries. You can see the R scripts and more technical detail on the process here. The State of the Union addresses up to 2007 are available here and the rest you can get here.
Model: TF-IDF
The first step in modeling is to create a Document Term Matrix, with the documents as the rows, the individual words along the columns, and a frequency count as the content. The Corpus object populates the term meta-data automatically during the tokenization process. However, it will be necessary to manually import the document names into the meta-data of the matrix.
From the Document Term Matrix, it is possible to create a Term Frequency - Inverse Document Frequency matrix. This object is a matrix of the same dimensions as the Document Term Frequency matrix above, except each frequency has been normalized to the frequency of the term in the entire document. This gives additional weight to a term that is common in a given document, but comparably rare in the entire corpus. At the same time, terms that are common across many or all documents are penalized in frequency for any single document as they provide a smaller amount of unique information about a given document.
Once the frequencies are calculated, a square matrix of all documents is processed as a distance lookup for clustering. The documents have a large number of terms, which means that the distance exists in very high dimensional space. It is for this reason that distance is computed as cosine similarity rather than normal euclidean distance.
The Text Clustering
After doing some setup, I worked through three models, doing some data vis along the way to get quick insight.
Model: Hierarchical Clustering
The first model was a hierarchical cluster, which showed the cohesion among clusters at all levels since the hierarchical method preserves all intermediate clusters. I used the Ward Method of clustering to place a heavy weight on the cohesiveness of a formed cluster at each step of the process. The goal was to learn implicit features about groups of documents.
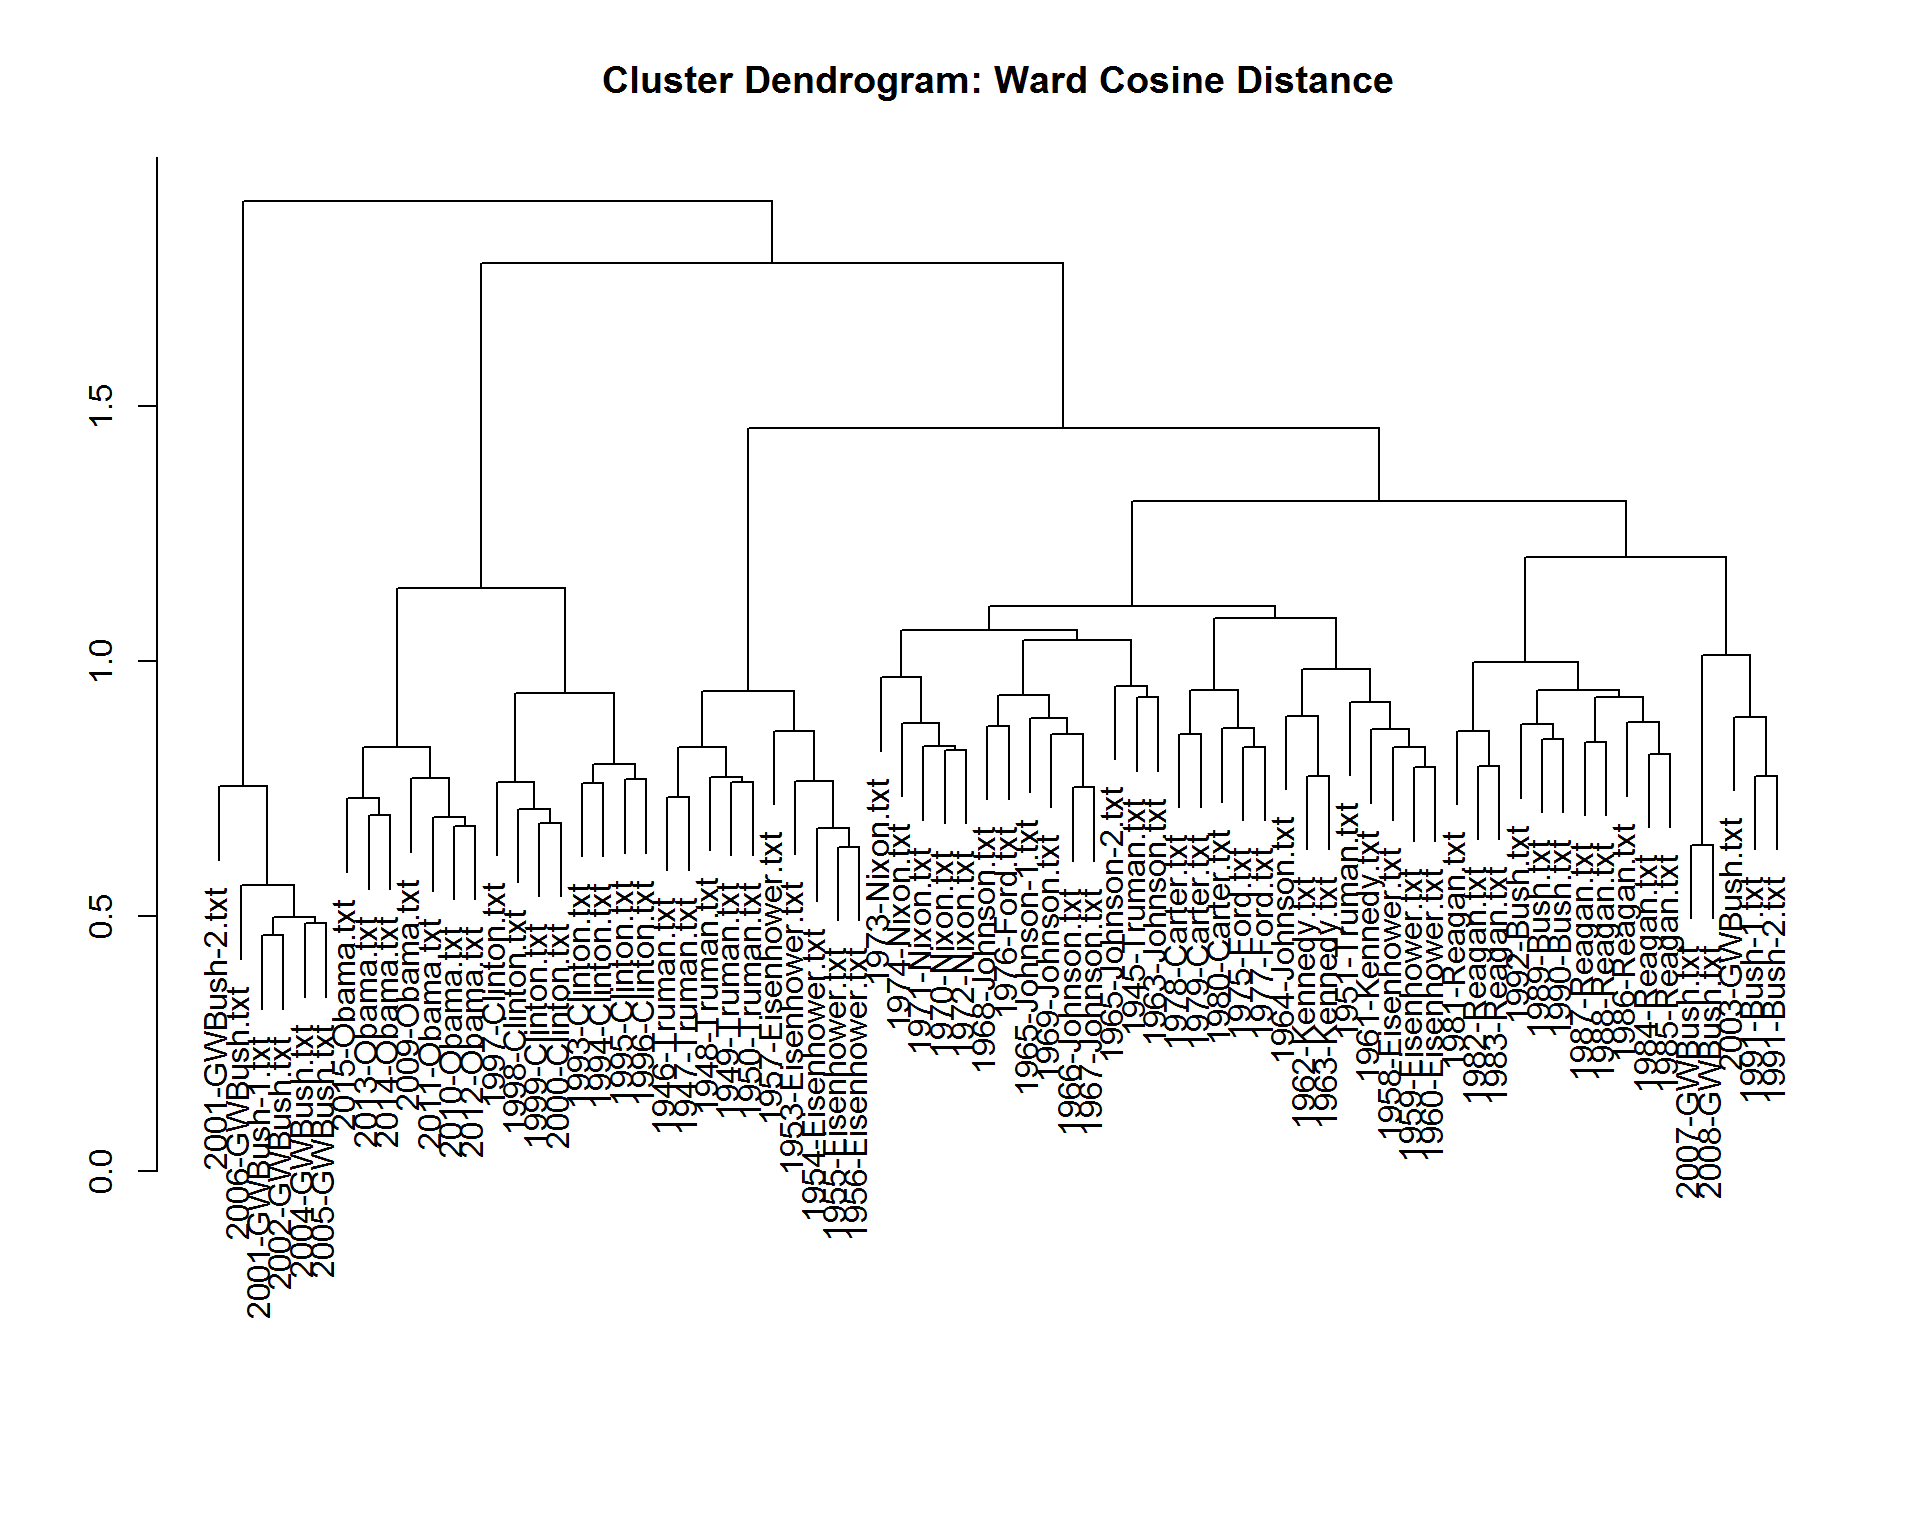
From this cluster dendrogram the first patterns are apparent and are as one might expect:
1. Speeches made by the same president are almost always the first to cluster.
2. Speeches from the same Political Party and Era are commonly next to cluster (Obama & Clinton, Reagan & Bush Sr., Eisenhower & Truman)
3. There is a set of potential outliers in 6 of George W. Bush’s speeches that are the last to merge with any others, though the balance of his speeches cluster as would be expected with Bush Sr. and Reagan.
To further define the clusters I next investigated cluster cohesiveness to see where it made sense to “cut the tree.”
This curve shows an expected gradual decline as the tree is cut from 20 clusters up to approaching the number of clusters as there are documents (i.e. each document in its own cluster). The ideal is to have as few clusters as necessary such that the Mean Cosine Distance within each cluster is minimized,indicating maximum cluster cohesiveness. There is a local minimum at about 5 clusters that is not surpassed in cohesiveness until closer to 40 clusters are computed.
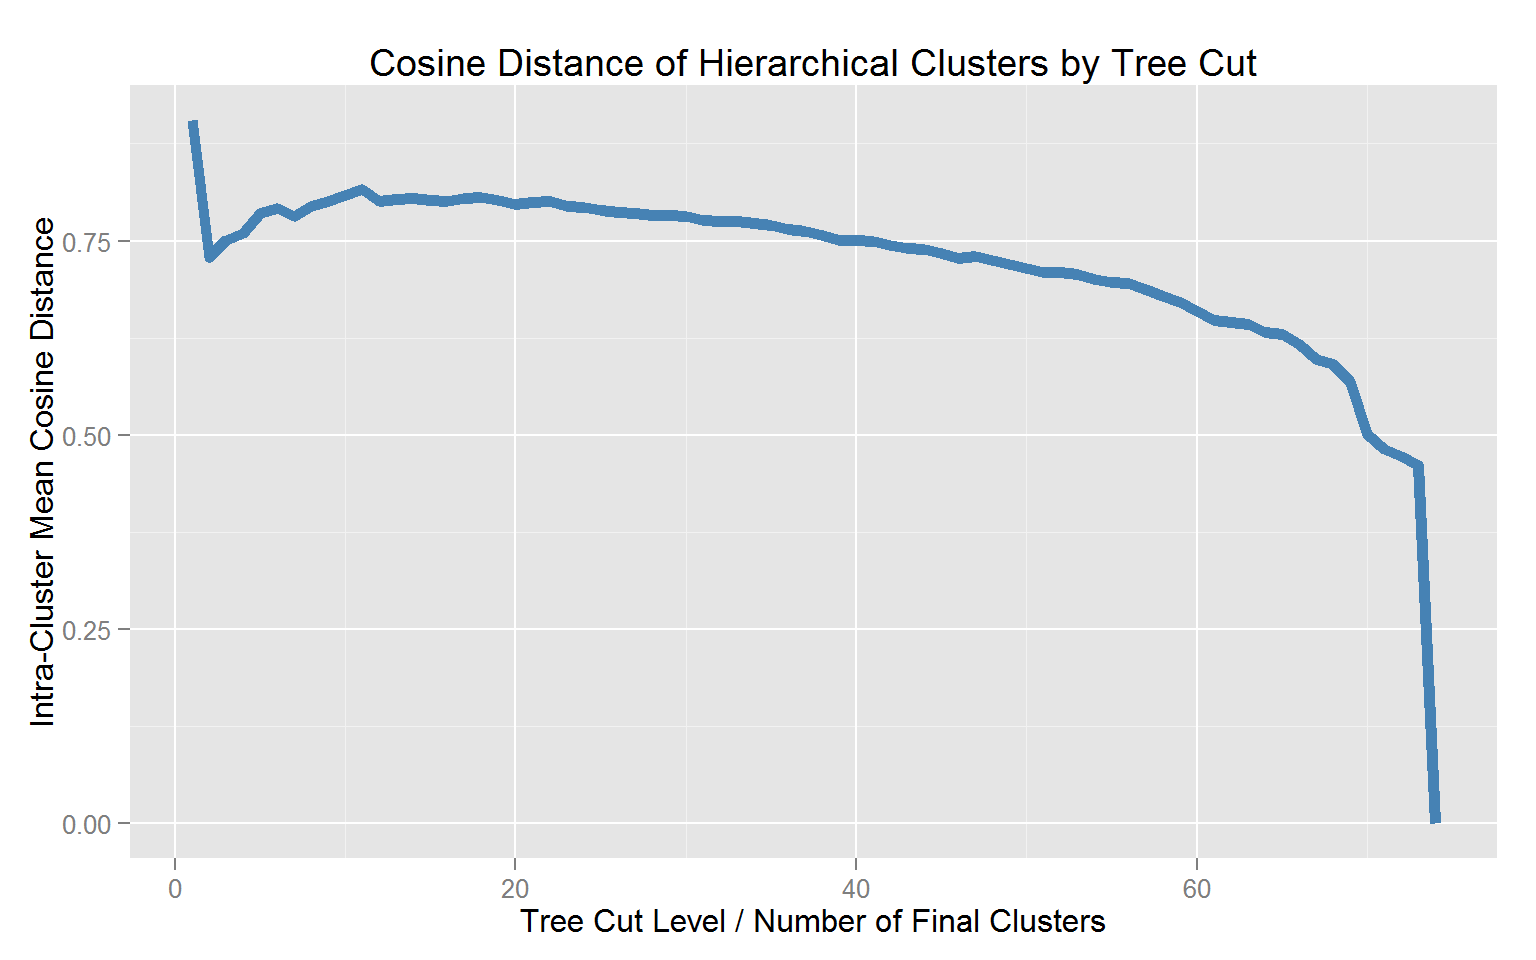
A cut that yields about 5 clusters results in about 15-18 documents per cluster, which appears to be a solid balance against higher cut levels. Let’s go with 5 clusters and see what we see.
Model: K-Means Cluster and Principle Components Analysis
To test the hierarchical cluster analysis, I used a K-Means cluster analysis to provide a more visual representation of the cluster space. K-Means relies on Euclidean Distance rather than Cosine Dissimilarity, it is first necessary to normalize the TF-IDF matrix. The K-Means process itself will cluster for 5 centroids, and increase the maximum iterations from the default of 10 to 25. You can check out the details of how here.
The data contains thousands of dimensions, a dimension for each unique word. Although the clusters are built using the full dimensional feature space, it will not be practical to visualize this many dimensions. To make visualization more palatable, I applied Principal Components Analysis to find the two most important dimensions.
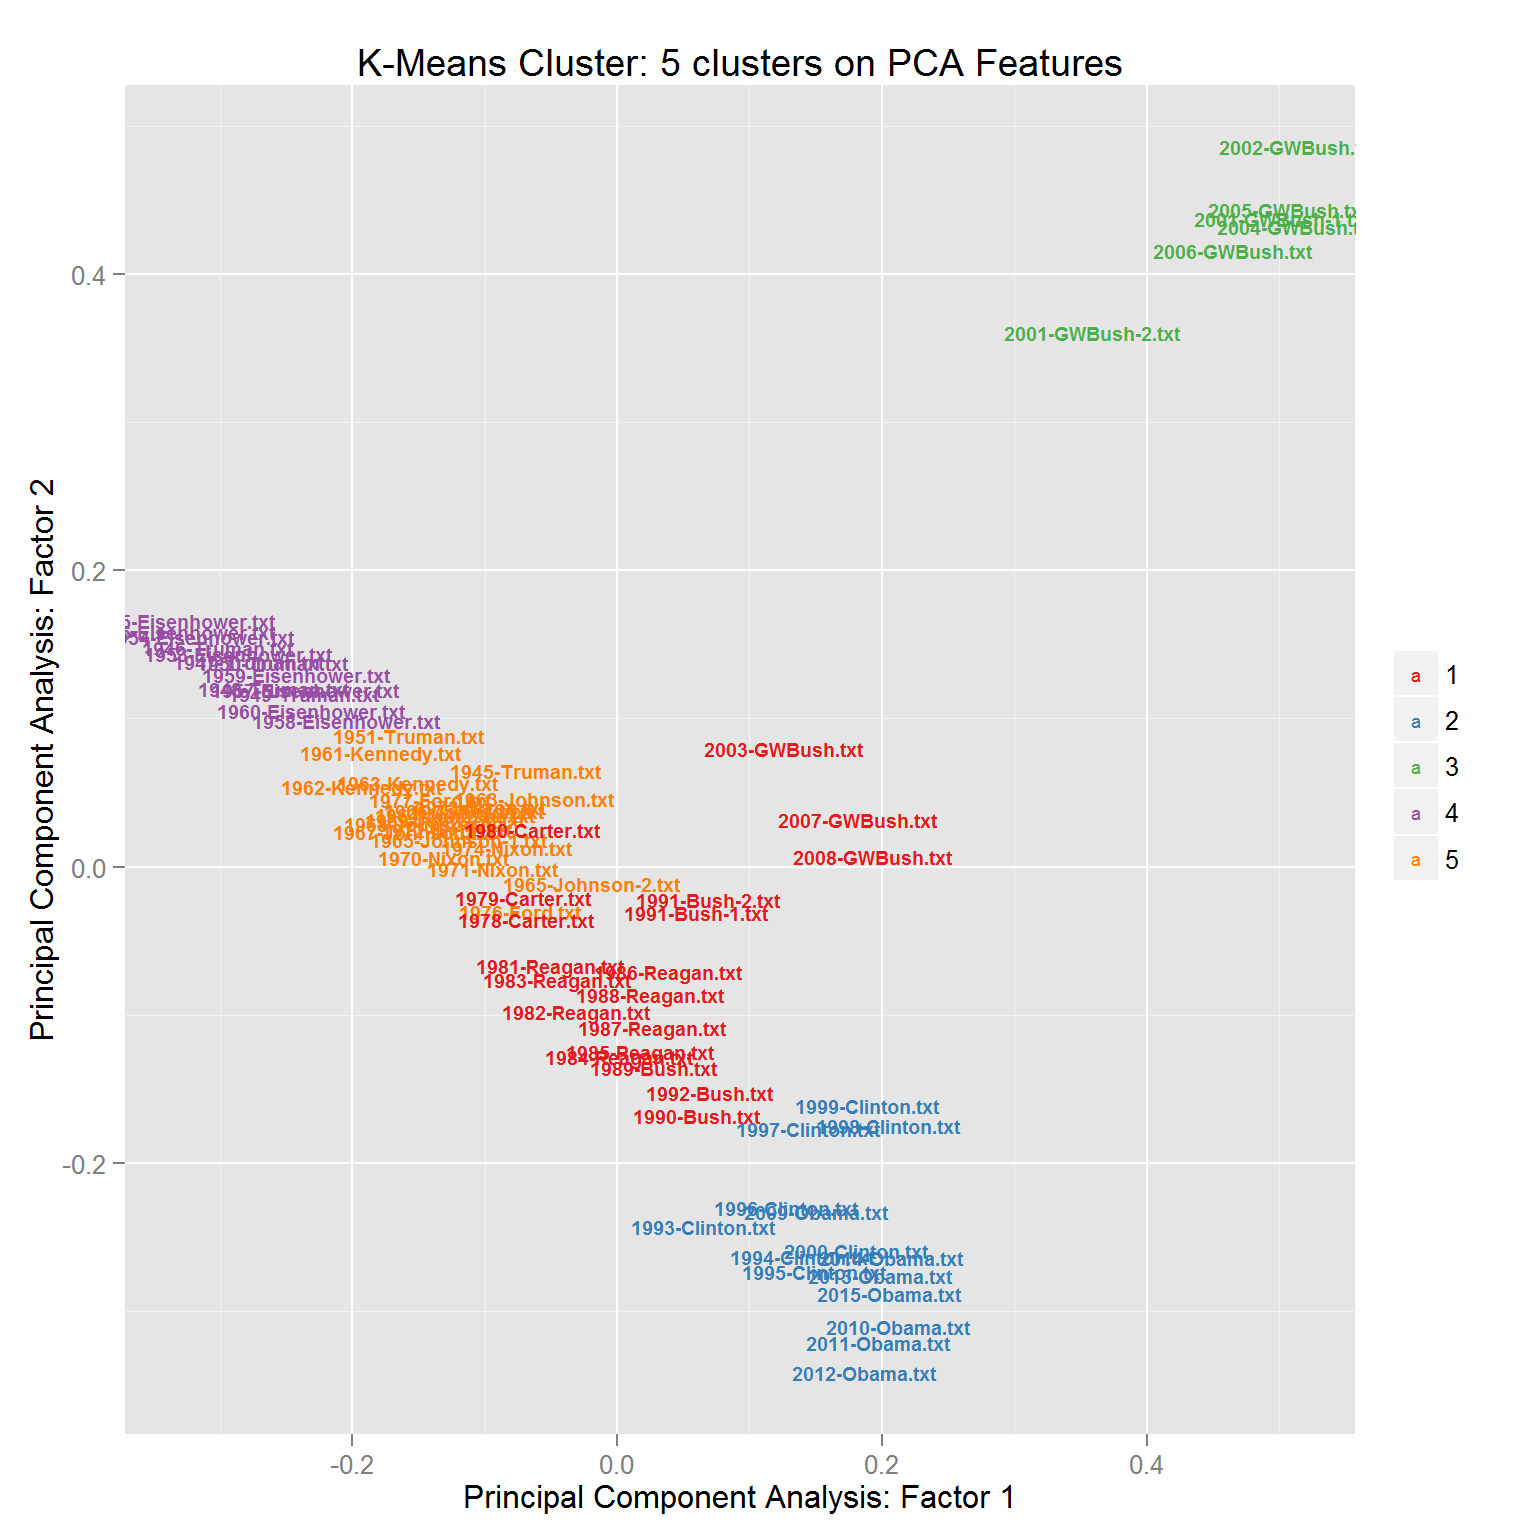
Many of the same patterns are apparent. The amount of distance among the same 6 George W. Bush speeches is stark from both the rest of the same era and party. It is additionally easy to see the same early level clusters among party and era combined. However, this visualization takes that context a step further. With the exception of George W. Bush’s speeches, the balance of speeches largely exist along a kind of spectrum that has roughly ordered the speeches across time, despite the fact that no date data is present in the model (it was stripped out in the loading step). So it appears that the content of the State of the Union addresses is largely driven by the era it is reflecting more that the political association of the president giving it.
Digging Deeper
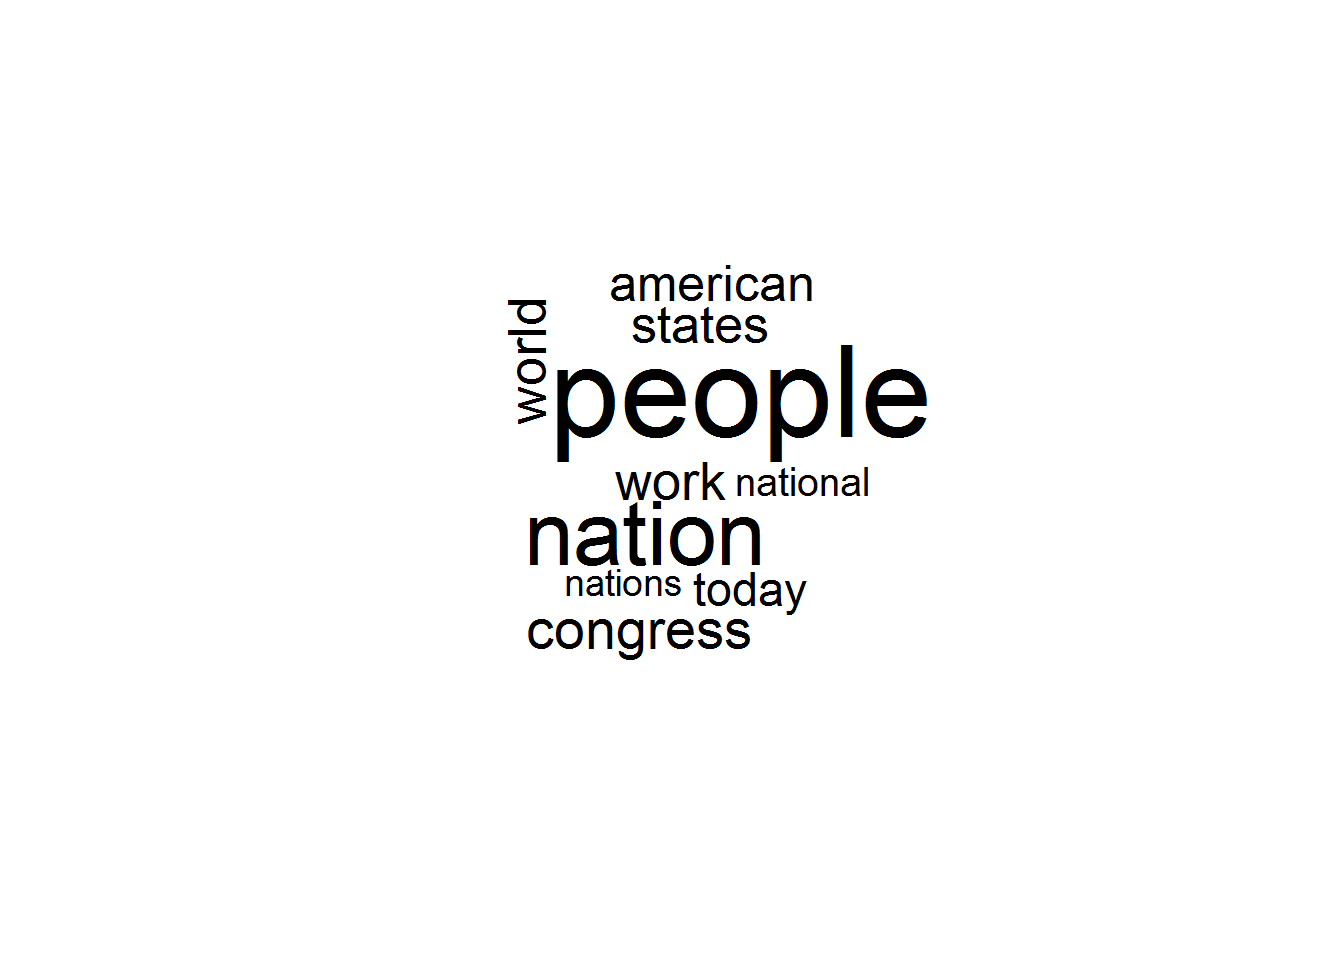
In order to dig deeper into underlying drivers, I wanted see the common terms that mean the most to each cluster. A simple and effective way to do that was a word cloud. You can see the R script here.
The terms common across all speeches were no surprise. They are the staple terms of presidential patriotism and political populism.
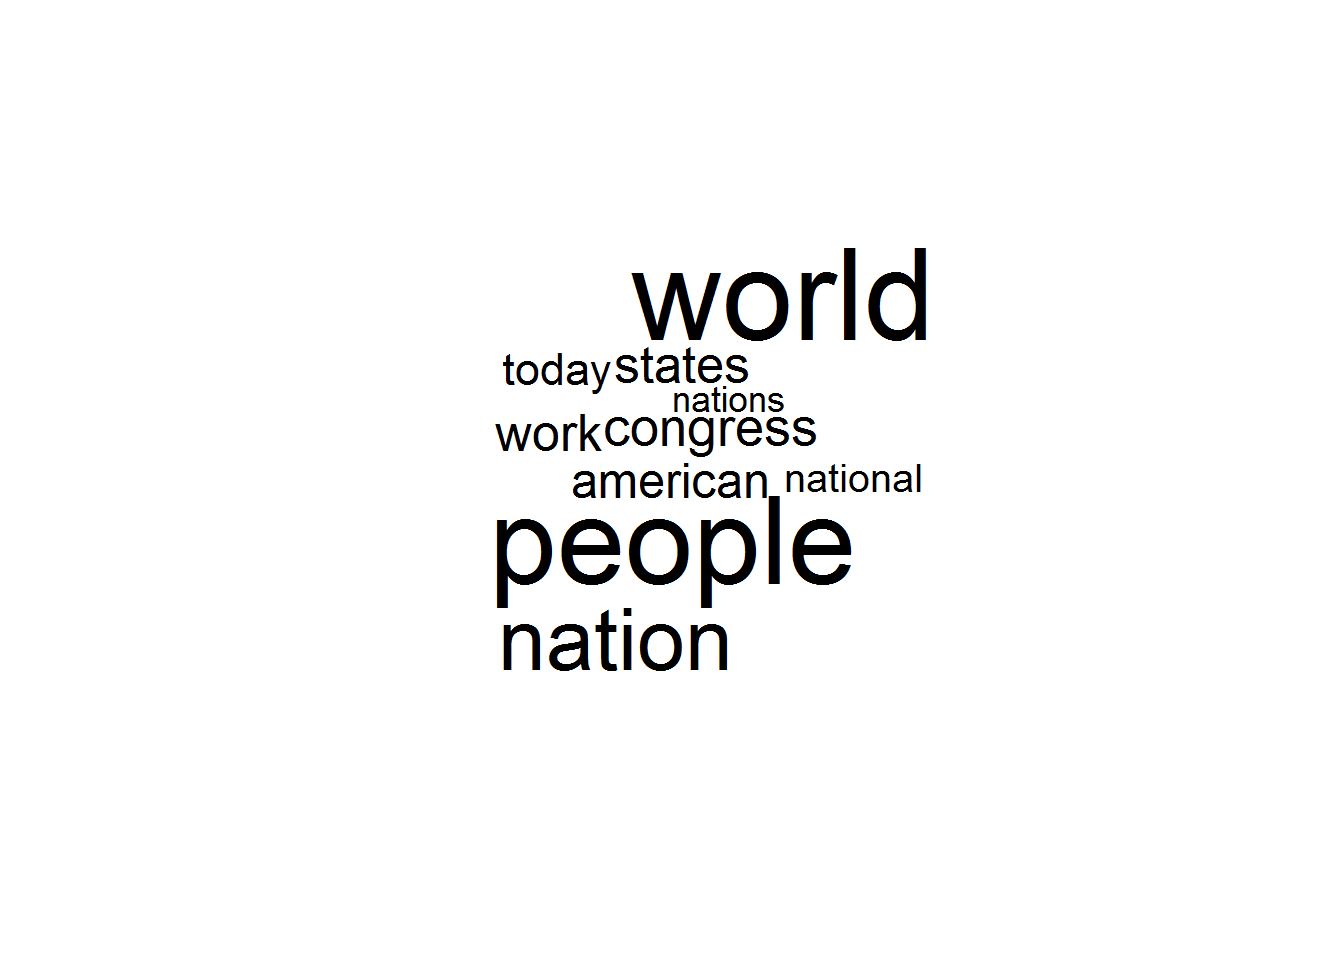
Spectrum vs. Outliers: Inspecting the words most common across the large spectrum shows a much larger emphasis on use of the word “world”, with many of the other terms occurring in s similar capacity.
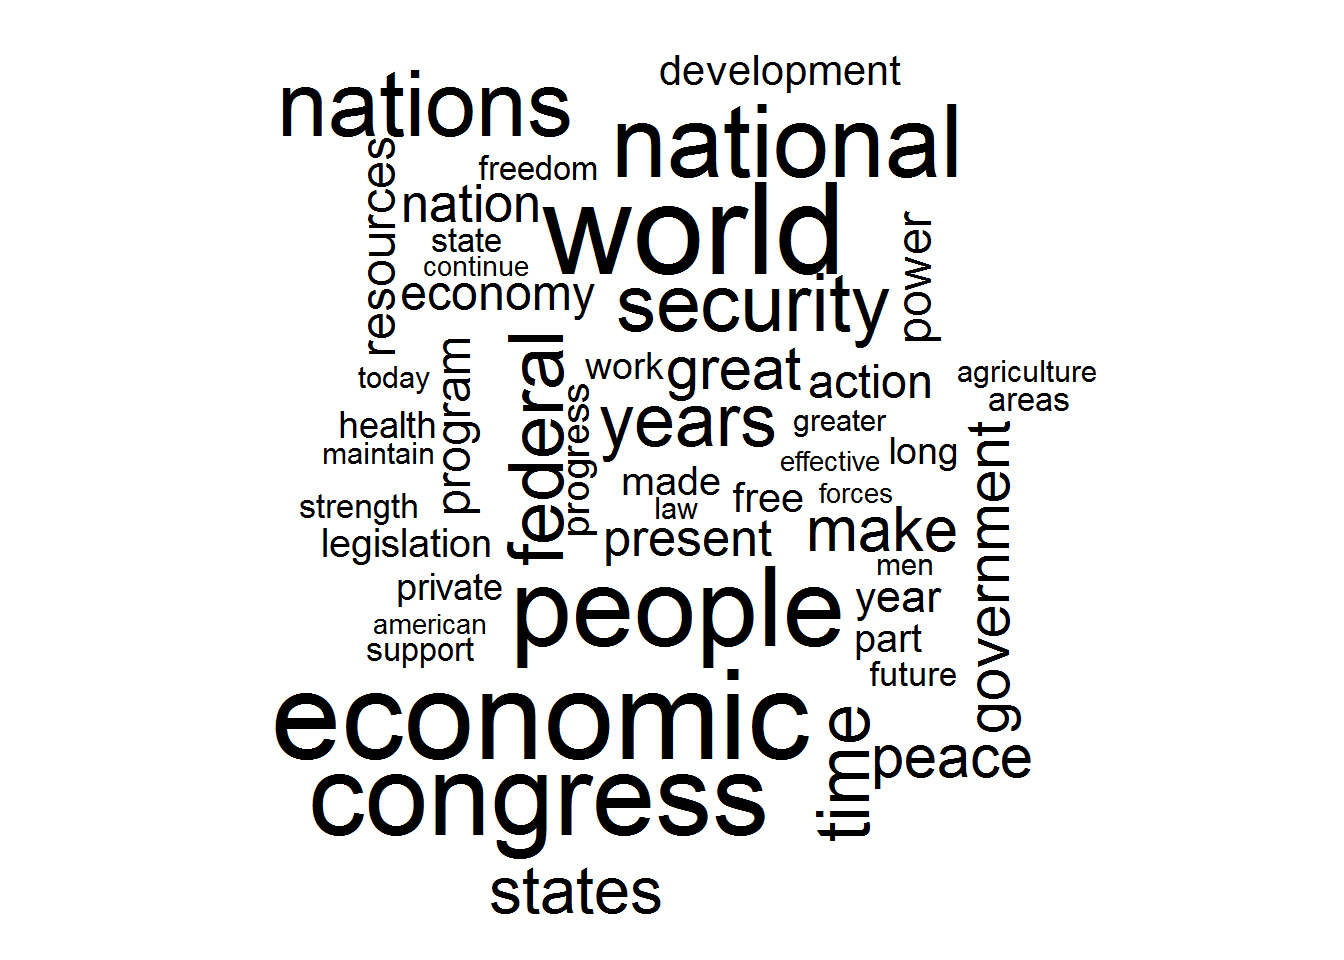
When I compared the the post-WWII set (cluster 4) to the most modern set (cluster 2), some interesting differences started to appear. The post-WWII/Korean War era speeches largely emphasize the “nation” and related terms, and reflect a concern for the recovering economy fresh from the scars of the Great Depression.
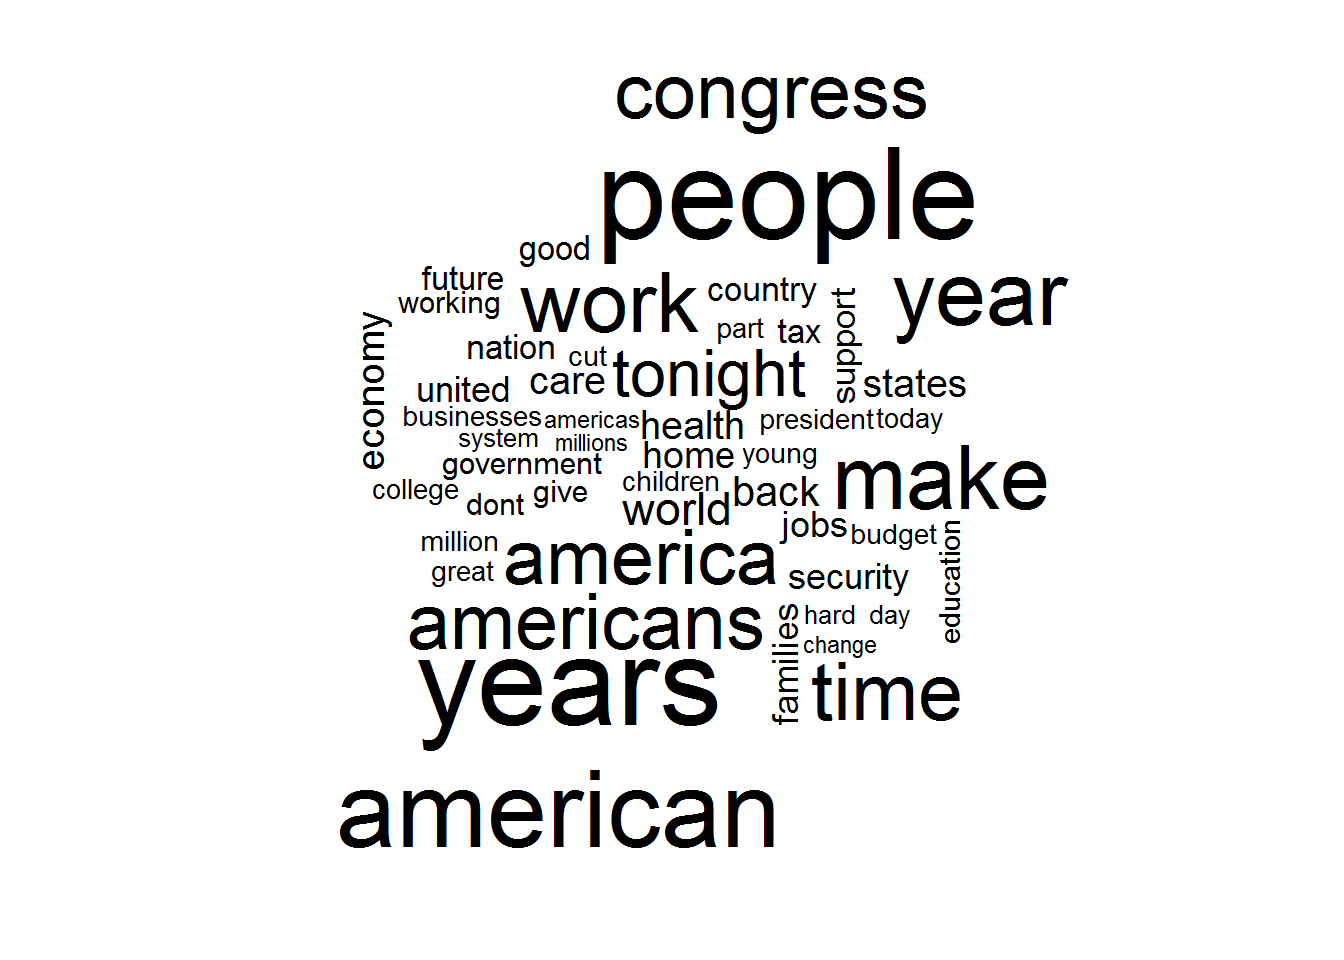
The tone is markedly different at the other end of the spectrum in the modern era. Multiple terms related to time are apparent, like “year/years” and “time”. There is additional a stark contrast in the use of “nation” in the earlier era to the explicit “america” in multiple forms.
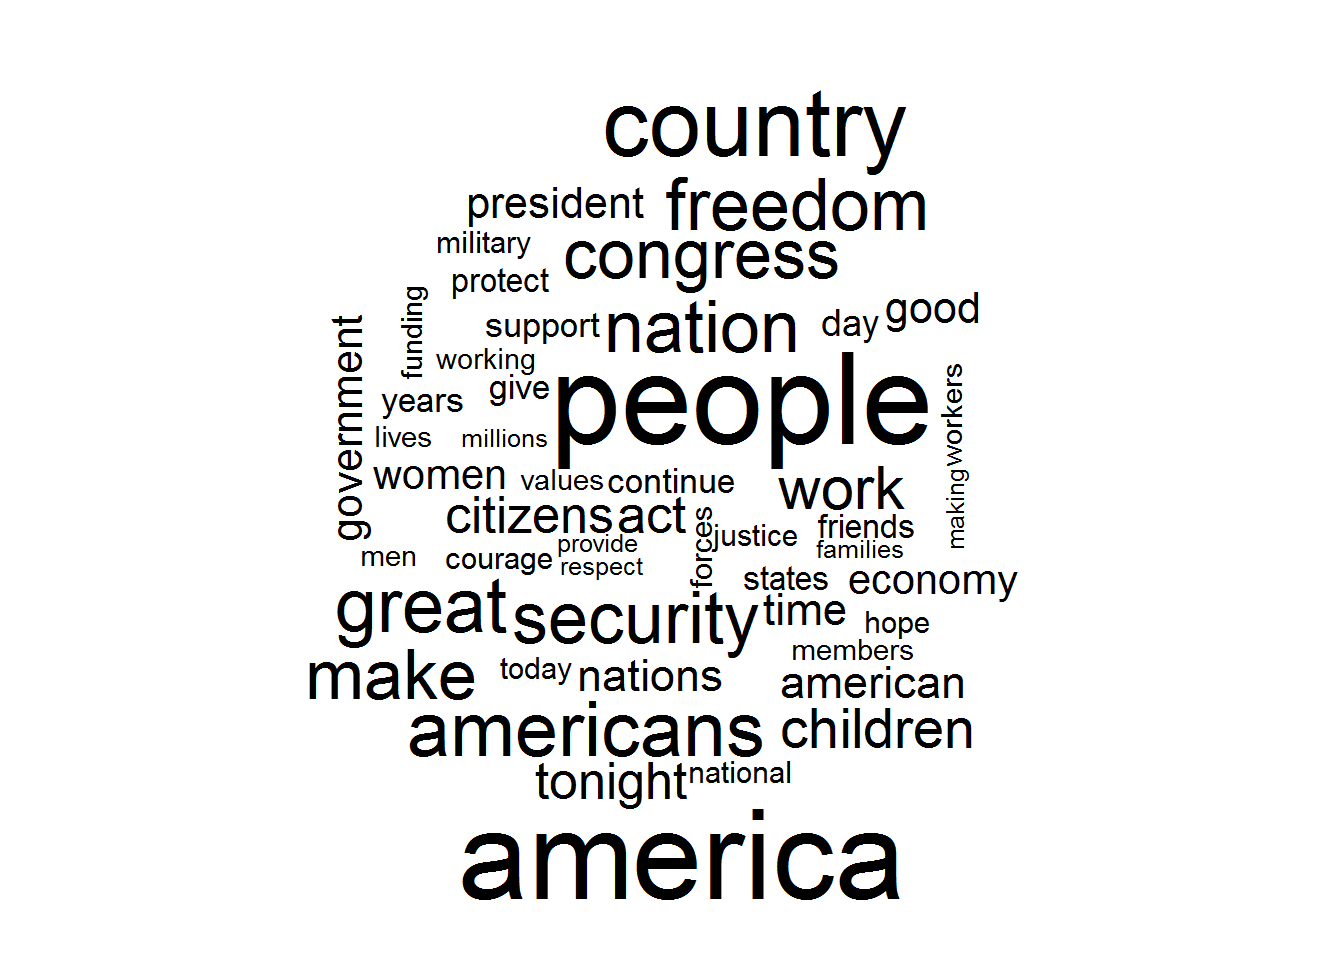
The potential outlier cluster housing 6 of George W. Bush’s speeches is heavily influenced by the frequent use of the word “applause”. Removing applause from the set, other differences immediately crop up. Where the large spectrum commonly used the term “nation”, these 6 speeches use other terms far more often like “america” and “country”. Additionally, other terms show up in higher frequency like “freedom” and “security.”
It appears as if the State of the Union speech largely reflects the time in which it is delivered. Though stylistic differences are detectable across a single president as well as a combination of the political party and era, the magnitude of difference is secondary to era. Democrat Jimmy Carter’s 1978 State of the Union has more in common with Republican Ronald Reagan’s 1981 speech than it does with fellow Democrat Bill Clinton’s 1993 speech. The outlier is George W. Bush, whose rhetoric appears different from his contemporaries. Was he different? Or were his eight years just a whole different era?
(Image source: http://pastdaily.com/wp-content/uploads/2013/02/lbj-state-of-the-union.jpg)
Comments