
The rise of Big Data created the need for data applications to be able to consume data residing in disparate databases, of wildly differing schema. The traditional approach to performing analytics on this sort of data has been to warehouse it; to move all the data into one place under a common schema so it can be analyzed.
This approach is no longer feasible with the volume of data being produced, the variety of data requiring specific optimized schemas, and the velocity of the creation of new data. A much more promising approach has been based on semantic link data, which models data as a graph (a network of nodes and edges) instead of as a series of relational tables.
To augment that approach, we’ve found that we can use machine learning to improve the semantic data models as the data set evolves. Our specific use-case is text data in millions of documents. We’ve found that machine learning facilitates the storage and exploration of data that would otherwise be too vast to support valuable insights.
Machine Learning and Exaptive
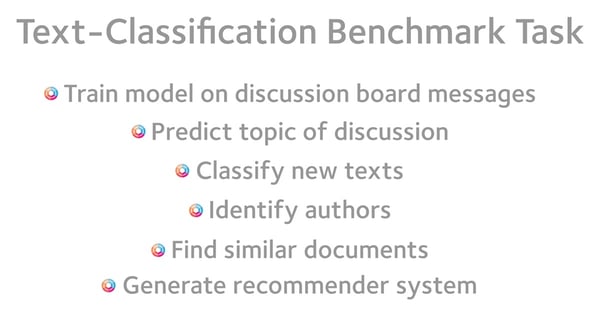
Machine Learning (ML) allows for a model to improve over time given new training data, without requiring more human effort. For example, a common text-classification benchmark task is to train a model on messages for multiple discussion board threads and then later use it to predict what the topic of discussion was (space, computers, religion, etc). Besides being able to classify new texts, ML approaches can also attempt to identify the authors or find similar documents. The ability to identify similar documents can lead to a recommender system for new content that a user might find interesting.
ML-based models are commonly desired to be black-box in the sense that a user desires to be able to put data in and get answers out, without having to know the details of how this is achieved. However, there is usually a desire to understand the resulting model and why a recommendation is given. This desire aligns nicely in the case of understanding a collection of texts, such as search results, where the user may want a summary of a 100 page list of 1000 ranked results. In this use case, we build a data application featuring a landscape visualization, which conveys the documents' similarities as well as the relationships to key terms which were identified when learning the model.
 ML and Data Landscape Exploration
In one application of data landscape technology, we processed over 100 million documents which had been machine read from scanned documents via optical character recognition (OCR). Some of the documents were hundreds of years old. We recorded counts for roughly 200,000 words and then estimated the importance of those words to the documents as a feature engineering step. This measure is known as term frequency-inverse document frequency (Tf-idf). Singular value decomposition (SVD) was then used to find high level concepts which are each defined by many words.
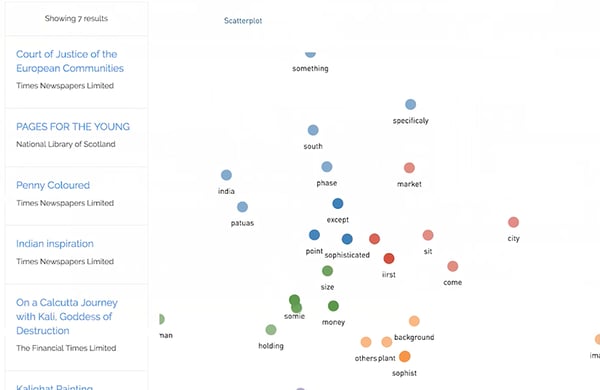
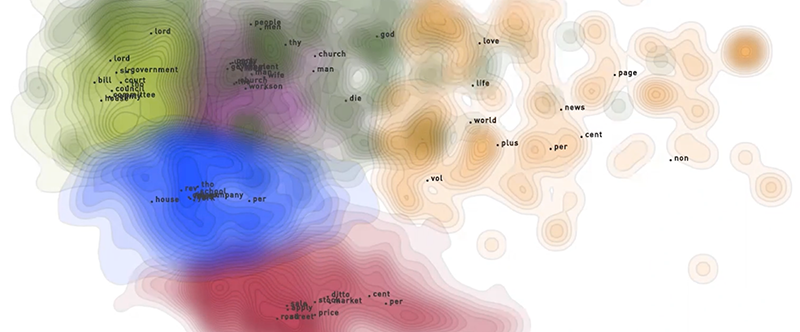
At that point in the process, documents are described by high level concepts that align with areas of medicine, economics, religion, politics, etc. The concepts that are learned are data-dependent: if only medical documents are used then the model’s resources will be used to find more finely-detailed categories. We then clustered the documents in that topic space to find which documents are similar. The silhouette coefficient measure allowed us to automatically select a good number of clusters. Next, we projected the documents down to a two dimensional scatterplot using a combination of SVD and multi-dimensional scaling (MDS). Based on the density of the documents, we fit a contour map, which looks like a topological map. Color varies across the contour map according to the cluster assignment for documents in that area. Finally, we solve for landmarks which correspond to the x,y location of the key driver terms for each cluster.
ML and PubMed® Explorer
Exaptive’s PubMed Explorer provides a visual interface for searching PubMed’s extensive collection of papers and visualizing search results. One of the visualizations provided is a term landscape. The term landscape is similar to the key term landmarks from the previously described data landscape.
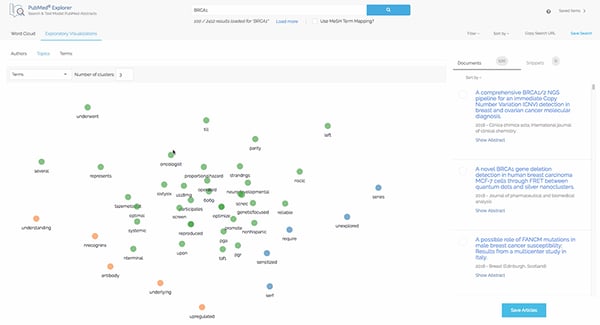
The positions are found in a more direct method by projecting Tf-idf values directly to 2D. For a collection of search results, the user may then view a two-dimensional landscape where related terms are grouped together spatially. Depending on how this project is performed, it is easy to obtain either the documents locations, or the term locations. This allows us to provide the PubMed user with options to create the same visualization for articles or journals, instead of topics. As with the previously described visualizations, the documents are categorized using clustering which provides for distinction with term/cluster color.
Artificial Intelligence vs Intelligence Augmentation
Many people associate ML with Artificial Intelligence (AI). At Exaptive, we use it to support Intelligence Augmentation (IA). The difference is that instead of using machine learning to eliminate the need for humans in a process, the technology supports the intelligence of the human researcher. In this way, we use machine reading and ML to help researchers accomplish more than what would otherwise be humanly possible.
Comments