
If you've ever tried to get a company to adopt new software you know how challenging it can be. Despite what seem to you like obvious benefits and your relentless communication, people selectively ignore or, worse, revolt against the change. Change efforts will even stumble in the face of this wisdom of the ages:

Image source: http://blog.timesunion.com/christopher/how-to-win-friends-and-influence-people/4687/
So what can you do to improve your chances of success?
Turning Outside In
I recently faced this challenge introducing new search and content management tools at a large law firm. I wondered if we could take a page from social network companies' playbooks. Could we mine an internal corporate network the same way Facebook and Twitter analyze their public networks, identify “influencers” at the firm, and create an internal influence map for the organization? We could then gain buy-in from these influential individuals and enlist them to get the word out.
No Small Feat
Social interaction mining is just a specific use case for network (graph) mining. If you can convert interactions into nodes and edges, you can harness the power of network mining tools that have proven useful across industries as diverse as computer network infrastructure and biotechnology. But for network mining to work, you need lots of data to distill meaningful interactions. Otherwise, the results can be skewed by a few outlier behaviors.
Social media companies have access to a treasure trove of data, with millions of interactions each day. But finding sufficient data within a smaller organization can be difficult. For most organizations, the obvious target is email. People send and receive hundreds of emails a day, which when multiplied across a company can reach the scale necessary for network mining.
In this case, though, we wanted to see how people interacted with content technologies. Lawyers produce almost as many documents as email, so we focused instead on activity in the firm's document management system.
Order from Chaos
I started by extracting 10 Million activity log records for a one year period using a basic SQL script. I did some basic cleansing by removing system-generated records and dropping people that were no longer at the firm. I also brought in relevant information about the person, including office, department and role, from our firm’s personnel systems.
From there, I needed to construct a map of relationships based on this granular activity data. I fell back on my favorite scripting language, Python, to ingest the data, group activity by document, identify who worked on the same document back-to-back (and therefore likely collaborated), and counted up the number of interactions.
The script outputted a file containing each two-person interaction and the number of times they collaborated on a document. I used Python to convert this to a GEXF graph network format, where each person is a node and each edge represents the number interactions. I dropped connections where two people only interacted a few times, both to keep the graph manageable and to remove chance encounters from the data. I also weighted nodes by total connections and interactions and included office, role and department to assist with visualization.
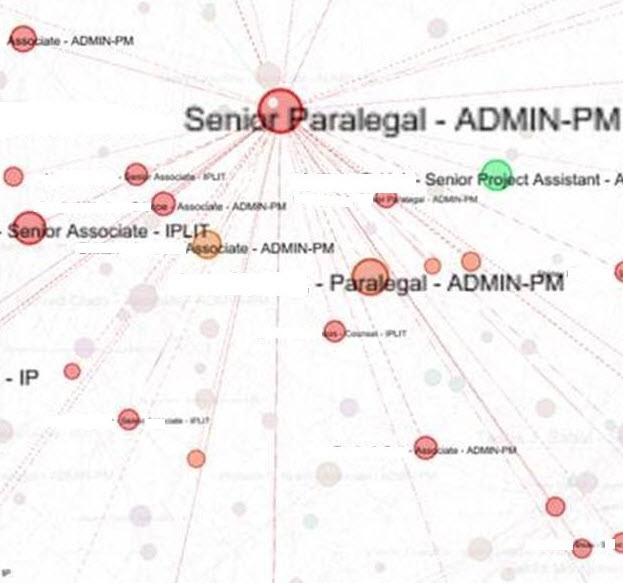
Surfing the Corporate Wide Web
To visualize the results, I used Gephi, an open-source graph browser. A sample is shown below.

I first validated the approach by looking at our own IT organization. The network analysis showed that heavily-matrixed managers, including business relationship managers and the firm's training manager, were the most influential and networked across departments and offices. This is consistent with our own experience, as these people are critical to the success of a product’s adoption.
I then shared the results with the project teams introducing search and content management tools, and we immediately saw some interesting trends within legal teams. People had assumed partners would be key influencers and that adoption would occur top-down. But the data suggested a more grassroots approach. The key influencers were more often paralegals and associates that were well connected and heavily engaged in day-to-day work.
We also found several influencers that bridged multiple practice groups and offices. These hyper-influencers had broad reach across the organization and could help spread technology across different cultural tribes. We validated these findings in subsequent conversations with legal teams.
Breaking the Cycle
The saying goes that the definition of insanity is doing the same thing over and over and expecting a different result. But most organizations do exactly that with their change programs. They throw “tried and true” approaches at technology introduction and wonder why no one is using it. The result? A littered trail of ill-used software, investments with paltry returns, and managers scratching their heads.
There is a better way. This social network analysis gave our project teams a map for targeting their change management activities, which is a vast improvement over the time-intensive blanket strategies you see in most organizations, including ours. And the punchline? The analysis took a total of 10 hours to complete over a long weekend.
If you have a need to spread change in an organization (and who doesn't?), don't drive blind. You will have much more success starting from a data-driven point of view, and it is more accessible than you think.
Comments